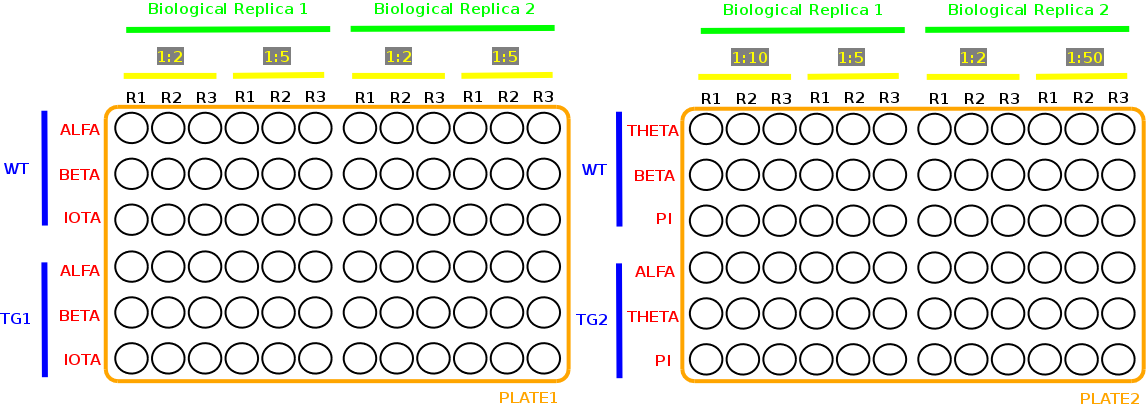
Figure 1. The analysis is requested for each plate, probe/gene, celltype, dilution pair and technical replica. Extend the group based on the already marked element. Afterwards, color a second group that could be used in the 'dilution pair'. Write pseudocode to access the various groups and elements.
Figure 2. The analysis is requested across plates and technical replicate, for each probe/gene, celltype, dilution pair. Extend the group based on the already marked element. Afterward, color a second group that could be used in the 'dilution pair'. Write pseudocode to access the various groups and elements.
Figure 3. The analysis is requested for each plate and probe, dilution pair, accross anything else: extend the group based on the already marked element. Afterwards, color a second group that could be used in the 'dilution pair'. Write pseudocode to access the various groups and elements.
Figure 4. The analysis is requested for each probe. Extend the group based on the already marked element. Afterwards, color a second group that could be used in the 'dilution pair'. Write pseudocode to access the various groups and elements.