| Home | Papers | Reports | Projects | Code Fragments | Dissertations | Presentations | Posters | Proposals | Lectures given | Course notes |
Model Inference and Simulation of the PI3 Kinase PathwayWerner Van Belle1* - werner@yellowcouch.org, werner.van.belle@gmail.com Abstract : Cell simulation is the mathematical modeling of the behavior of a cell such that the model can be algorithmically executed, thereby enabling visualized prediction of the behavior of real living cells. Such models will be useful in the future to optimize and regulate biological processes such as the growth of yeasts, fungi and to find new medicines which merely regulate and coerce the cell in working differently/correctly (cancer research, diabetes, ...). In Norway, model inferencing techniques and learning techniques are being used at some institutions (Jonathan M. Irish, Randi Hovland et al, and Bø, T. H., Dysvik, B., Jonassen), nevertheless these models are seldom used in a predictive cell simulating context. As far as we know, there is currently no active research around whole cell simulation in Norway. From a methodological point of view it is clear that new methodological approaches that include molecular biology, cellular imaging, real-time kinetic analysis and network integrated analysis are required to progress in understanding the nature of signaling specificity. To keep track of and to quantify the complexity of pathways, a computational approach seems essential.
Keywords:
Cell Simulation, Model Inferencing, PI3 Kinase |
Background
Cell simulation is the mathematical modeling of the behavior of a cell such that the model can be algorithmically executed, thereby enabling visualized prediction of the behavior of real living cells. Such models will be useful in the future to optimize and regulate biological processes such as the growth of yeasts, fungi and to find new medicines which merely regulate and coerce the cell in working differently/correctly (cancer research, diabetes, ...). Indications of the importance of cell simulation exist at Heidelberg (Billewits et al, Gumbel et al) and at a number of universities in Japan (Yugi K., Tomita M. Takahashi, K., Kaizu, K. Hu, ...). Some research groups and companies go even as far as to already define standards for cell state description. This is illustrated through the cooperation between Brussels Free University and Heidelberg in the SmartCell Project (Ander, M. et al), the Virtual Cell project (Slepchenko BM, Schaff J, Macara IG, Loew LM.) or the Systems Biology Workbench (http://smbl.org/).
In Norway, model inferencing techniques and learning techniques are being used at some institutions (Jonathan M. Irish, Randi Hovland et al, and Bø, T. H., Dysvik, B., Jonassen), nevertheless these models are seldom used in a predictive cell simulating context. As far as we know, there is currently no active research around whole cell simulation in Norway.
We believe that a cooperation of the academic environment (Department of Biomedicine, University of Bergen, Norway) and an applied mathematical modeling institute (The Earth Observation Group in cooperation with the Bioinformatics Group at Norut IT, Tromsø, Norway) is the right place to research and start developing this idea. Especially given projects such as FUGE that have attracted many highly qualified researchers and created bioinformatics knowhow at various places. Not only has this brought Norway to the cutting edge of functional genomics, it now enables us to go a step further.
Furthermore, from a methodological point of view it is clear that new methodological approaches that include molecular biology, cellular imaging, real-time kinetic analysis and network integrated analysis are required to progress in understanding the nature of signaling specificity. To keep track of and to quantify the complexity of pathways, a computational approach seems essential.
Aims
The goal of this project is to develop an integrated cell simulation using advanced mathematical techniques such as model inference (which protein interactions are relevant), model inversion (how to map chemo-kinetics of known activation/inhibition relations to observations) and forward model execution (how to integrate this information into a visualized system with predictive power).
The starting point will be to create a computer simulation of proteins and protein modifications related to PI3 kinase. The created simulation should be able to predict (part of) the cell-state over time when presented with a specific stimulus. The cell-state will be described as the localization and quantity of a number of different proteins and protein modifications. The stimula we will use are related to temperature, light, external cell signals presented as single impulses, pulse trains or as continues signals. For all those different stimula we aim to generate one integrated simulation.
The advantages offered by this research are manifold:
- Cell simulation requires coherent and correct information. This research project will lead to a better understanding of the pathways involved with PI3 kinases. What are the critical components of the PI3K pathways? Is there any interaction between PDK2 and PDK1 in activating Akt ? Is there any interaction between Akt and Akt related kinases like SGK and CISK?
- Computers can automatically take into account all modeled factors, which is nearly impossible for human experts. This will undoubtly generate conflicts which might otherwise go unnoticed to the human expert. These conflicts can then be experimentally resolved. This will in turn facilitate the sharing of models and the collaborative construction of 'supermodels'.
- Simulation offers possibilities that are impossible to verify experimentally. For example, it could be possible to specify a certain target cell-state and then leave the computer to find out what different mechanisms might lead to such a cell-state. This kind of backward execution is impossible in real life.
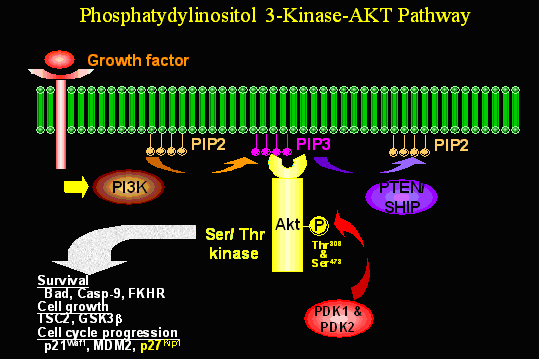
Phosphatydylinositol 3-Kinase-AKT Pathway
 Since
its discovery as a proto-oncogene nearly ten years ago, the
serine/threonine kinase Akt, also known as protein kinase B (PKB),
has become a major focus of attention because of its critical
regulatory role in diverse cellular processes, including cancer
progression. The Akt cascade is activated by receptor tyrosine
kinases, integrins, B- and T-cell receptors, cytokine receptors,
G-protein coupled receptors, and other stimuli that induce the
accumulation of phosphatidylinositol 3,4,5 triphosphates,
(PtdIns(3,4,5)P3), by the phosphoinositide 3-kinase (PI3K). The three
Akt isoforms (Akt1, Akt2 and Akt3) thus mediate many of the
downstream events regulated by PI3K. For instance, Akt is a major
regulator of insulin signaling and glucose metabolism. Akt controls
cell growth through its effects on the mTOR and p70 S6 kinase
pathways, as well as the cell cycle and cell proliferation through
its direct action on the CDK inhibitors, p21 and p27, and indirectly
by affecting the levels of cyclin D1 and p53. Akt is also major
mediator of cell survival by directly inhibiting different
pro-apoptotic signals such as Bad and the Forkhead family of
transcription factors, or indirectly by modulating two central
regulators of cell death such as p53 and NFKB. Akt signaling in
endothelial cells also plays critical roles in the regulation of
vascular homeostasis and angiogenesis. These findings have turned
Akt/PKB into an important therapeutic target for the treatment of
cancer, diabetes and stroke.
Since
its discovery as a proto-oncogene nearly ten years ago, the
serine/threonine kinase Akt, also known as protein kinase B (PKB),
has become a major focus of attention because of its critical
regulatory role in diverse cellular processes, including cancer
progression. The Akt cascade is activated by receptor tyrosine
kinases, integrins, B- and T-cell receptors, cytokine receptors,
G-protein coupled receptors, and other stimuli that induce the
accumulation of phosphatidylinositol 3,4,5 triphosphates,
(PtdIns(3,4,5)P3), by the phosphoinositide 3-kinase (PI3K). The three
Akt isoforms (Akt1, Akt2 and Akt3) thus mediate many of the
downstream events regulated by PI3K. For instance, Akt is a major
regulator of insulin signaling and glucose metabolism. Akt controls
cell growth through its effects on the mTOR and p70 S6 kinase
pathways, as well as the cell cycle and cell proliferation through
its direct action on the CDK inhibitors, p21 and p27, and indirectly
by affecting the levels of cyclin D1 and p53. Akt is also major
mediator of cell survival by directly inhibiting different
pro-apoptotic signals such as Bad and the Forkhead family of
transcription factors, or indirectly by modulating two central
regulators of cell death such as p53 and NFKB. Akt signaling in
endothelial cells also plays critical roles in the regulation of
vascular homeostasis and angiogenesis. These findings have turned
Akt/PKB into an important therapeutic target for the treatment of
cancer, diabetes and stroke.
Furthermore, the interaction of PtdIns-3,4,5-P3 with the PH domain of Akt promotes the translocation of Akt to the plasma membrane, where it undergoes phosphorylation at two sites: (Thr308) in the activation loop and (Ser473) in the carboxy-terminal tail. The kinase that phosphorylates Akt at the Thr308 is PI-3K dependent kinase 1, or PDK-1. The identity of the kinase that phosphorylates Akt at Ser473 (PDK-2) remains elusive, although it appears to be membrane associated. Several kinases, including ILK-1. PDK1, Akt itself, and perhaps other AGC kinases, have the potential to phosphorylate Akt at this site. Phosphorylated AKT has been shown to translocate from the plasma membrane to the cytosol or nuclear. Activated Akt ultimately undergoes dephosphorylation by phosphatasesd and returns to inactivate state. Other Akt interactors may regulate Akt phosphorylation, its subcellular location or stability.
Disorders of these systems lead to serious diseases like diabetes, metabolic syndrome, small size and cancer. The mechanisms by which Akt is activated is complex. For example a family of small proteins typifies by the product of the T cell lymphoma 1 locus, TCL- some of which are upregulated in murine leukimias-bind to themselves as well as to Akt, and can induce the formation of stable oligomers of Akt.
In addition Act, related kinases such as GSK and CISK might perform cooperative overlapping and/or distinct functions under normal physiological conditions. The difficulty will be in distinguishing the real Akt targets from those of SGK and CISK. This is particularly relevant for designing therapeutic strategies that counter the effects of increased PI3K signaling, as both Akt and SGK have both similar and distinct activation routes.
State Of The Art
Signal transduction pathways - Although quantitative data on cellular processes other than metabolism are still relatively sparse, scientists have modeled some systems with considerable success. An example is the signal transduction pathway controlling bacterial chemotaxis. Signal transduction pathways ordinarily have much fewer reactant molecules than metabolic systems. ODE-based models reveals the underlying stochastic behavior of such molecular interactions. Accordingly, researchers have attempted to model signal transduction pathways with stochastic computation instead of deterministic methods, such as ODEs. Further modeling efforts have taken place on the analysis of the yeast genome using micro array experiments and wavelet analysis (Robert R. Klevecz).
Metabolic networks - Other mathematical simulation is performed in the Netherlands (http://www.science.uva.nl/research/scs/CellMath/) where mathematical models are made of metabolic and regulatory networks, including intrinsic spatial non-homogeneity. Depending on the cellular phenomenon considered, models and methods of appropriate temporal and spatial scales are used. The models can be described as ordinary differential equations (ODE's); Simulation is performed using multi-adaptive computational methods for partial differential equations (PDEs) including moderate spatial and temporal variability within a cell or an organelle; particle models describing the interaction of individual molecules and computational methods for the evaluation of the dynamic behavior are also considered. Their research further focuses on 1) system reduction techniques for ordinary differential equations (ODEs) of the type that arises in chemical networks (simplification and modularization in the chemical `dimension') 2). particle-based methods for modeling of features with high spatial variability or low number of molecules. 3) how different approaches can be integrated into a single simulation.
Gene expression systems - Gene expression systems, such as the simulation of gene expression in phage-lambda, have also been successfully modeled. Like signal pathways, they tend to contain a small number of molecular entities, including transcription factors, polymerases, and genes. These lowcopy- number molecules orchestrate gene expression in a highly stochastic fashion. For example, the stochastic behavior of gene-expression’s initial phase has binary consequences: binding a rare transcription factor and a single gene in a cell can determine whether the gene is turned on or off. In many cases, we can best model gene expression systems with stochastic equations. There are many other ways to model this phenomenon, however, depending on the modeler’s interests. For example, we can use ODE models (linear and mass action models), S-System models, or binary and multi-reaction models. Gene expression systems have rich interactions with other cellular processes. These systems can control metabolic flux by changing the enzyme concentration while being regulated by signaling proteins. DNA binding factors, which are derived from other genes, dynamically regulate chromosomal structure. When modeling a whole cell, elements in the gene expression system sometimes need information about elements in other systems to allow cross-system interaction.
Simulation environments - The most advanced simulation environment is undoubtly E-Cell (http://www.e-cell.org/). This software (of which the research was initiated in 1998 !) has become a test platform for a whole range of simulations. A vast range of different biological problems has been modeled and simulated with it already. Among those: the control dynamics of mitochondrial metabolism (Katsuyuki Yugi), the reproduction of neural cell behavior at a molecular level using kinetic equations (Shinichi Kikuchi), the energy metabolism of E-coli (Kenta Hashimoto), gene product simulation of the rice genome in order to predict the resulting plant metabolism (Nobuyoshi Ishii, Yoichi Nakayama), models for insuline and diabetes (Atsuko Sano, Yasuhiro Naito), the circadian rhythm in Synechococcus sp. (Fumihiko Miyoshi, Yoichi Nakayama) and a steady state computer model of the human erythrocyte involving three major metabolic pathways, glycolysis, the pentose phosphate pathway, nucleotide metabolism, and also ion transport systems. (Ayako Kinoshita, Yoichi Nakayama).
An important aspect of the E-cell system is a research project involving the determination of kinetic parameters with as few experiments as possible (Kikuchi, S., Fujimoto, K., Kitagawa, N., et al.). Often simulations require kinetic data of biochemical reactions. However it is generally difficult to obtain them only from literature. One solution is to measure values directly using wet experiments. Though the "wet-approach" is valuable they found out that a “dry” approach, which makes use of physical underlying models is also required to estimate parameters computationally from limited data (this process is called model inversion). The E-cell team currently develops methods for metabolic control analysis, mebolic flux analysis and flux balance analysis, including the application of control theory (reinforcement learning techniques) to cell simulation.
Spatial simulation - Another area where predictive models are used is at the Ellenberg Group. They use an experimental and computational approach to the functional dynamics of nuclear structure during the cell cycle. Thereby using quantitative confocal microscopy and fluorescently tagged (GFP and other fluorophores) proteins to directly observe key proteins of the cell dynamic processes. They then use biophysical methods such as photobleaching and fluorescence resonance energy transfer to analyze protein function in situ during nuclear remodeling. Because of the complexity of the involved kinetics and geometry in live cells, mathematical models were necessary to built predictive models of the biological processes. (Lehotzky, A., Tirian, L., Tokesi, N., Lenart, P., Szabo, B., Kovacs, J. & Ovadi, J).
Project Description
The project we propose contains two different experimental tracks. The first set of experiments will be concerned with analysis of 2D gels sampled from initially synchronized cels. The second set of experiments will make use of Flow Cytometry in to obtain spatial protein information. Subsequently, these experiments will provide input for the models we will develop; and then into the creation of a simulated cell.
Data acquisition will be performed at the department of biomedicine at the university of Bergen. One PhD position and support from one technician is requested for this work. Data integration, model building and model simulation will be done at the bioinformatics group at Norut IT. One research position is requested for this.
Workpackage 1: Data Acquisition
Phospho-specific analyses of any kind, flow cytometry and Western alike, are based on the premise that the phosphorylation state of a particular protein correlates with its biological status. For kinases, phosphorylation typically enhances their enzymatic activity (e.g. AKT and PDK1, propagating signals downstream.
2D Gels
We will obtain kinetic data on protein modification by sampling a synchronized cell line at specific times. First we develop a synchronization protocol which will bring all cells in the same biological state. Candidates for this are heat shock, pheromones, UV light, sound, apoptosis and starvation. Which one will yield the best synchronization is still unclear. Further use of flow cytometry to select a consistent cell population will increase the accuracy of the experiments substantially. For example, by selecting cells of the same size/age, or at the same starvation point. The antibodies we plan to use are 9611SPhospho-(Ser/Thr) Akt Substrate Antibody, 9606S Phospho(Ser) 14-3-3 Binding Motif (4E2) Mouse mAb, 9411 Phospho-Tyrosine Mouse mAb (P-Tyr-100) and 9391SPhospho-Threonine-Proline Mouse mAb (P-Thr-Pro-101).
Deliverable 1.1: protocol on synchronization, sampling and staining for the specific pathway.
After synchronization, the cells will be be sampled at specific (regular or decaying) time intervals and flash-dryed in order to have the highest sampling resolution possible. We plan to run around 100 gels per cellsystem, which indicates that the high throughput material available at the university will be necessary.
Deliverable 1.2: digitized images of 2D gels at specific times of synchronized cell lines.
Flow Cytometry
Phospho-protein analysis by flow cytometric techniques is a unique method for analyzing signaling in cell types that are too rare or few in number for typical biochemical analyses. It is an extermely powerful multiparameter method which can profile several kinases simultaneously. It can provide information about the functional responses to stimuli that are immediately reflective of intracellular events (in contrast to surface staining). Recently, major advances have been made in both flow cytometry machinery and applications, expanding the number of possible simultaneous analysis parameters to 13 or more. Flow cytometry will further be applied to create homogenous cell populations.
Deliverable
1.3: an optimized flow cytometric process to select equally
phased cells.
Deliverable 1.4: an optimized flow cytometric
process to image spatial phosphorilation of different kinases.
The department of biomedicine in Bergen has flow cytometric facilities. In the near future it will be supplied with a BD FACSAri which incorporates a fixed-alignment cuvette flow cell that can detect up to 13 colors for a total of 15 parameters. They further developed software to allow rapid identification of cells among hundreds of samples.
Workpackage 2: Data Integration
The described experiments will lead to two different kinds of data sets: flow cytometric data and protein isoform distributions ran on 2D gel. Integration of these two data sources will be performed through appropriate normalization schemes (alignment, direction and intensity normalization for 2D gels). Specifically maximum entropy methods will be investigated in order to increase the accuracy of the 2D gel images as well as unsmoothing based on Wiener filtering and deconvolution (Jim Leinbach). Normalization of flow cytometric cell images will be done by selecting the properly directed cells which give the most information and spatial information with respect to the relative positioning of the different proteins. Normalization of the different time axis will be done by using algorithms developed for SAR radar image unwarping (H. Johnsen, I.Lauknes and T.Guneriussen). After normalization, we will integrate the flow cytometric data onto the 2D gel images by linking intra-cel spatial information to every pixel. As such, in the remainder of the proposal we assume that all information has been integrated on the 2D gel.
Deliverable
2.1: A normalized set of 2D gel
images.
Deliverable 2.2:
A normalized set of volumetric cell images.
Workpackage 3: Modeling of data
The modeling of the data will be approached from two different angles. In one approach we will create a model based on the measured dataset and create step wise executable estimators based on learning techniques. In the second approach we make use of known chemical dependencies and typical Michaelis Menton kinetics (this is model inversion).
The differential system to describe a model will contain a mixture of bounded and unbounded partial differential equations. The spatial information will be bounded by the condition that the cell membrane has a specific protein expression. The time dependent information is only bounded by a start condition.
Deliverable 3.1: a computer language to describe the different models as differential equations.
Learning methods
Modeling 2D gels based on learning techniques will be performed in different step. First we will model the 2D gels time dependent behavior on a pixel per pixel basis. There is evidence that this will already yield important information. In a previous project in cooperation with Bjørn Tore Gjertsen we showed how P53 isoform distributions relate closely to different kinetic parameters. In this small experiment both the variance of the protein intensities as well as the correlation was high, indicating a strong possibility for extrapolation of the results. The underlying model we will use in the PI3 experiment are the best distribution fits under the assumption of lineair time scale behavior or exponential time scale behavior.
Deliverable 3.2: protein expression estimators based on a position dependent distribution analysis and parameter fitting-curves.
Such a model will already give a wealth of information. However, more information can be obtained by linking different spots on the 2D gels to each other. The related spots will first be determined by a Bayesian analysis (Gelman, A.; Carlin, J.; Stern, H. and Rubin, D.). This kind of analysis has already been used to clean out protein interaction maps and create datasets which take the measurement context into account (Ronald Jansen or L. Giot, J.S.Bader, C. Brouwer, A. Chaudhuri).
Deliverable 3.3: Bayesian network describing the high confidence protein relationships.
After obtaining the important relationships between the different protein isoforms we will make use of continuous reinforcement learning methods (Q-learning, gradient descent learning neural networks) which will use the roots of the Bayesian network as impulses and the mismatch between the protein and the predicted protein as a reward. This will create the necessary differential equations for model execution later on.
Deliverable 3.4: model learned from the experiments using reinforcement learning techniques.
We also plan to extend the Bayesian analysis into the spectral domain. This will enable us to study oscillating phenomena and chemical equilibra as well. To achieve this we will change the protein intensity 2D gell stack into a protein frequency 2D gel stack. This can be done either through fourier analysis or wavelet (Robert R. Klevecz) analysis. The latter will probably achieve better results in the presence of clear events.
Deliverable 3.5: model learned from the experiments using reinforcement learning techniques in the spectral domain.
Model inversion
A second track we will investigate is the use of chemo-physical kinetic models. This should theoretically enable us to achieve much better results since we have a priori information on what is possible and what is not possible. Much of the modeling will be based on generalized Michaelis-Menton equations as well as the large body of differential equations used in the E-Cell research project. These equations typically describe how different factors can be combined to determine a resulting protein expression. They basically state the allowed forms for a physically correct relation. (Rainer Breitling or Mendes, P & Kell, D.B).
Deliverable 3.6: report on the proposed chemo physcial kinetic model.
The kinetic coefficients we will need to resolve is rather large if many isoforms are present. As such we will limit the chemo-physical models by the bayesian relations we perceived earlier, supported by known information from literature. Available pathway databases contain a wealth of information on protein interaction relation ships (Karp PD). They typically specify activation and inhibition which can easily be modeled using differential equations (Rainer Breitling). Further information is available from a high quality protein interaction map available from Curagens extensive measurement effort (L. Giot, J.S.Bader, C. Brouwer, A. Chaudhuri)
Deliverable 3.7: Additional
information to support the Bayesian network created
earlier.
Deliverable 3.8: Inverted model described as
differential equations based on chemo physical kinetics.
Workpackage 4: Simulation
The simulation of the model will be conducted using step wise procedures, of which Lax method is the best candidate given its efficiency. We will further include a straight forward spatial diffusion model based on work done by (Carslaw and Jaeger; Crank or Kirkham and Powers). A possible alternative to the simulation model is the use of spectral information of the data set to determine the necessary step-size for Eulers method. In order to reduce the size of the simulation we will also experiment with system reduction in which we first reduce the 3 dimensional spatial description onto a 2 dimensional projection and finally onto a one dimensional description.
Deliverable 4.1: simulator using Lax
method.
Deliverable 4.2: extentions to the spatial model
using diffusion equations.
Deliverable 4.3: report on the
impact of model folding on the performance and accuracy.
|
|
|
|
Unclustered visualisation of the protein interaction map of the Drosophila Melanogaster. |
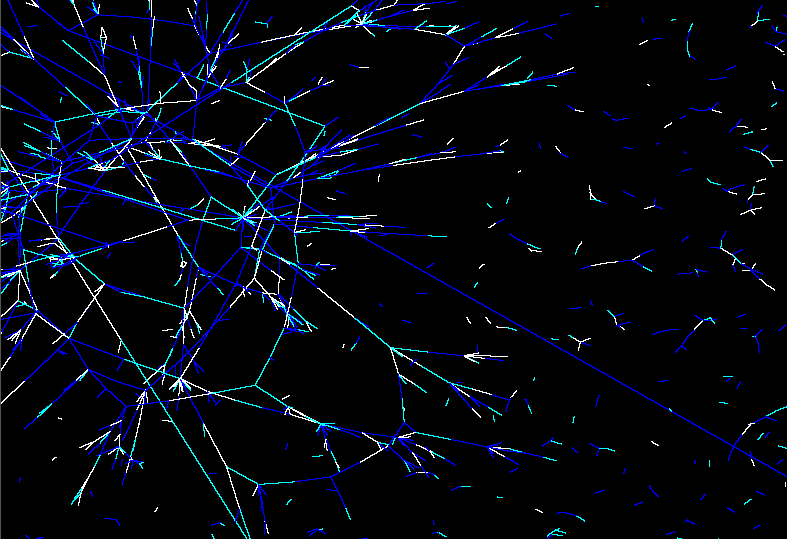
Zoom in of this protein interaction map. White are strong interactions. Turquose are weaker interactions. Blue are weak interactions. |
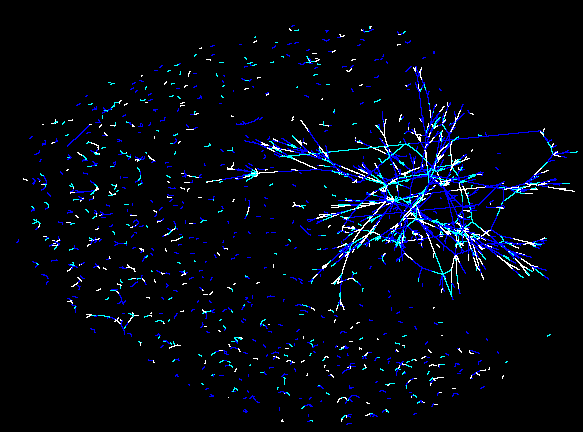
The simulation itself will be visualized in three different ways. We will create a visualization of a) how the 2D gel of the system will look like at a given time frame, b) how much of certain protein is available superimposed over an unclustered protein interaction map (see figure, or online at http://bio4.itek.norut.no/interaction2004/), c) where a certain protein is localized in the cell.
Deliverable 4.4a, 4.4b, 4.4c: 3 different modules to visualize the cell state
The simulation will be extended to allow for backward execution. In general we expect this to be a difficult task because many possible start states can lead to the same end state, especially if smoothing conditions such as diffusion are present. We however believe that it should be possible to reverse the model because cells in real life do not diffuse away in strict entropy.
Deliverable 4.5: a report on the backward model investigation and if possible a demonstrator of backward simulation.
Partners
Norut IT
Norut IT is an applied research institute located in Tromsø. It employs 14 physicist and a group of computer scientists. Their close cooperation with ESA and NASA with respect to earth observation has allowed them to built a high level of competence in model inversion. Specific projects of interest are those where physical models are initially not tuned to match reality (such as atmospheric diffraction patterns, ocean waves and their relation to wind). By using model inversion techniques those physical correct, but untuned, models become predictors and allow for high quality simulations. This expertise is currently being transferred into bioinformatics. Norut is furthermore part of the BIT forum (Biotechnology in Tromsø) and a recently founded collaboration was realized under the form of a biotechnology process laboratory, which will be located in Tromsø. Norut is further also member of the regional FUGE organizing committee.
Department of Medicine
The Department of Biomedicine consists of a Section of Anatomy and cell biology, a Section of Biochemistry and molecular biology and a Section of Physiology. The department conducts basic biomedical research within the same areas. The staff size is 200. About 40 scientists in faculty positions, 50 PhD students and post doctoral fellows, 50 Master degree students and 60 technicians are organized in three sections and 30 research groups that cover a variety of research fields within the above three main areas.
In addition to the master students, 450 medical students, 100 odontology students, 15 farmacology and dentist secretary students are lectured at the department each year. In 2003 the department moved into a new and well-equipped research building close to Haukeland University Hospital, Bergen. Furthermore the tow National platforms (The Molecular Imaging Center (MIC) and the Proteomic (PROBE) is placed at the Department MIC is a technological facility providing a variety of equipment, and scientific and technical expertise for the general research community of Norway. The mission of the Center is to maintain and develop modern technologies of biological imaging, and make them available to scientists to be applied in specific projects carried out in different research fields, such as Cell and Developmental Biology, Neurobiology, and Cancer Biology. PROBE is a core facility for proteomics to aid Norwegian researchers in the identification and characterization of expressed proteins in any given biological sample.
References
- Helene Billewitz and Ute Platzer and Hans-Peter Meinzer (2002) - Simulation of genetic networks with an inhomogeneous distribution of cell contents. In: D , Kim J. und Martinez T Polani (ed.), Fifth German workshop on Artificial Life: Abstracting and Synthesizing the Principles of Living Systems.. pp. 77-79. Published by Akad. Verl.-Ges. Aka. ISBN 3-89838-030-0 and 1-58603-242-9.
- M. Gumbel and R. Schnabel and H P. Meinzer (2000) - Analysis of Cell Migrations in C. elegans using Computer Simulations. In: Proceedings of the 14th European Simulation Multiconference (SCS Publications), :605-611.
- Yugi, K., and Tomita, M. - A general computational model of mitochondrial metabolism; Bioinformatics (2004) 20(11):1795-1796.
- Takahashi, K., Kaizu, K. Hu, B., and Tomita, M. - A multi-algorithm, multi-timescale method for cell simulation; Bioinformatics (2004) 20(4):538-546.
- Kikuchi, S., Fujimoto, K., Kitagawa, N., et al., Kinetic simulation of signal transduction system in hippocampal long-term potentiation with dynamic modeling of protein phosphatase 2A, Neural Networks (2003) 16(9):1389-1398.
- Ander, M. et al: “Smartcell, a framework to simulate cellular processes that combines stochastic approximation with diffusion and localisation: analysis of simple networks”, Syst. Biol., 2004, 1, pp. 129-138.
- Slepchenko BM, Schaff J, Macara IG, Loew LM. 2003 – Quantitative Cell Biology with the Virtual Cell. Trends in Cell Biology 13:pp. 570 – 576.
- Moraru II, Schaff JC, Slepchenko BM, Loew LM. 2002 – The virtual cell: an integrated modeling environment for experimental and computational cell biology. Ann N Y Acad Sci 971:595-6
- Carslaw, H. S. and J. C. Jaeger, 1967. Conduction of heat in solids. Oxford University Press, New York, p. 54-56.
- Crank, J., 1956. The mathematics of diffusion. Oxford University Press, New York, p. 12-15.
- Kirkham, D. and W. L. Powers, 1972. Advanced soil physics. Wiley-Interscience, A division of John Wiley & Sons, Inc., New York.
- Bø, T. H., Dysvik, B., Jonassen, I. (2004) LSimpute: accurate estimation of missing values in microarray data with least squares methods. Nucl. Acids Res. 32:e34
- Jonathan M. Irish, Randi Hovland, Peter O. Krutzik, Omar D. Perez, Øystein Bruserud, Bjørn T. Gjertsen, Garry Nolan – Single Cell Profiling of Potentiated Phospho-Protein Networks in Cancer Cells In: Cell Vol 118, 217-228, July 23, 2004
- Lehotzky, A., Tirian, L., Tokesi, N., Lenart, P., Szabo, B., Kovacs, J. & Ovadi, J., Dynamic targeting of microtubules by TPPP/p25 affects cell survival. J Cell Sci 2004 Dec 1;117(Pt 25):6249-59.
- Jim Leinbach, Wiener spiking deconvolution and minimum-phase wavelets: A tutorial, The Leading Edge, Volume 14, Issue 3, pp. 189-192 (March 1995)
- Gelman, A.; Carlin, J.; Stern, H. and Rubin, D., Bayesian Data Analysis. Boca Raton, FL: Chapman & Hall, 1995.
- Ronald Jansen; Combining multiple genomic data sources into reliable predictions of protein complexes; Memorial Sloan-Kettering Cancer Center; Computational Biology Center
- L. Giot, J.S.Bader, C. Brouwer, A. Chaudhuri; A Protein Interaction Map of Drosophila Melanogaster; science vol 302, 5 december 2003
- Robert R. Klevecz; Dynamic architecture of the yeast cell cycle uncovered by wavelet decomposition of expression microarray data; Func. Integ. Genomics (2000); 1:186-192
- Rainer Breitling (R.Breitling@bio.gla.ac.uk): Modeling biological systems with differential equations; Bioinformatics Research Center; February 2004
- Mendes, P & Kell, D.B. (1998) Non-linear optimization of biochemical pathways; applications to metabolic engineering and parameter estimation. Bioinformatics 14, 869-883
- Karp PD; Pathway databases: a case study in computational symbolic theories; Science. 2001 Sep 14;293(5537):2040-4.
- Johnsen H., I.
Lauknes, and T. Guneriussen; Geocoding of fast-delivery SAR image mode
product using DEM data; Int.J.Remote Sens.,16, pp. 1957-1968, 1996
- Lauknes I. and E. Malnes; Automatical Geocoding of SAR products; In Proceedings of Envisat Symposium, 6-10 september, Salzburg, Austria 2004.
| http://werner.yellowcouch.org/ werner@yellowcouch.org |  |