| Home | Papers | Reports | Projects | Code Fragments | Dissertations | Presentations | Posters | Proposals | Lectures given | Course notes |
CodFormatics: Design of a Bioinformatic System to Assist the Cod Breeding ProgramTor Flå1+ - tor@math.uit.no Abstract : As input to the national codbreeding program, it is important to identify regions within the genome that are responsible for quantitative properties (QTL's). Obtaining these however is complicated by the huge amount of involved (environmental) factors. To be able to approach this problem we propose the creation of a bioinformatics tool that will a) help in analysing current datasets and b) help in guiding future experiments. E.g; by carefully selecting a set of fishes with the most desirable properties it might be possible to find the QTL much quicker than what would be possible by analysing all fishes.
Keywords:
QTL Analysis, Cod Breeding |
1. Summary

2.Background
The Atlantic cod (Gadus morhua), is widely distributed across the continental shelf regions of the North Atlantic. Several important cod stocks are of great economic and social importance. In Norwegian waters, the Norwegian-Arctic stock, which spends most of its life in the Barents Sea, is of most importance.
The genome of Atlantic cod is thought to consist of a number of autosomes and a pair of sex chromosomes. Into these chromosomes is packed a DNA sequence estimated to several millions base pairs (bp) in length. This DNA sequence codes for many genes interspersed with long stretches of DNA with apparently little or no function. An Atlantic cod seems to inherit two copies of every gene (except those on the sex chomosomes) from each of its parents and these two copies may differ from each other in their exact DNA sequence. Such polymorphism is by no means rare and in a population as a whole, there may be several million sites through the genome where a variant occurs in some individuals. Thus, any two randomly chosen fishes probably differ at hundreds of thousands of locations through their genomes. Most of these differences have no effect but when alternative alleles do cause functionally different proteins to be produced or control alternative expression of genes, they may cause variation between fishes in performance.
Traits such as growth, temperature tolerance, and flesh quality are controlled by many loci that are inherited quantitatively (QTL). Identifying such loci is of considerable economic and evolutionary significance, in effect, could contribute to ensure quality traits for farmed fish. We propose to search for such markers linked to QTL responsible for growth, diseases resistance, phenotypic values of quality, and productivity traits, which can be integrated into a selective breeding. Such an approach, termed marker-assisted selection (MAS), is expected to increase genetic response by affecting intensity and accuracy of selection.
3.Necessity of Advanced QTL Analysis Methods
Environmental and Epistasis Factors: It appears that fish are phenotypically more variable than other vertebrates. In particular, differences in growth rate, body size and weight are frequently observed within as well between populations of fish including cod. The large phenotypic variation observed in fish is not necessarily associated with greater genetic variability. Heritabilities for similar traits such as body length and weight are generally much lower within fish populations compared to other vertebrates. The higher levels of phenotypic variation, coupled with the lower heritabilities, indicate greater susceptibility to environmental factors:
-
The indeterminate growth capacity of most fishes permits greater adjustment to environmental factors, such as food availability and crowding.
-
Fish are more sensitive than homoisothermic birds and mammals to variations in temperature directly affecting metabolic processes.
-
Age and size at sexual maturity are interrelated in fish in a way that permits great flexibility without loss of reproductive success.
The above discussion emphasize the importance of analyzing methods for QTL which are oriented towards environmental- genetic interaction and epistasis. In our simulations of QTLs and marker effects, we will therefore collaborate with CIGENE and use their Virtual genome project to simulate QTL's with such effects included to challenge our analysis.
4.Project Description
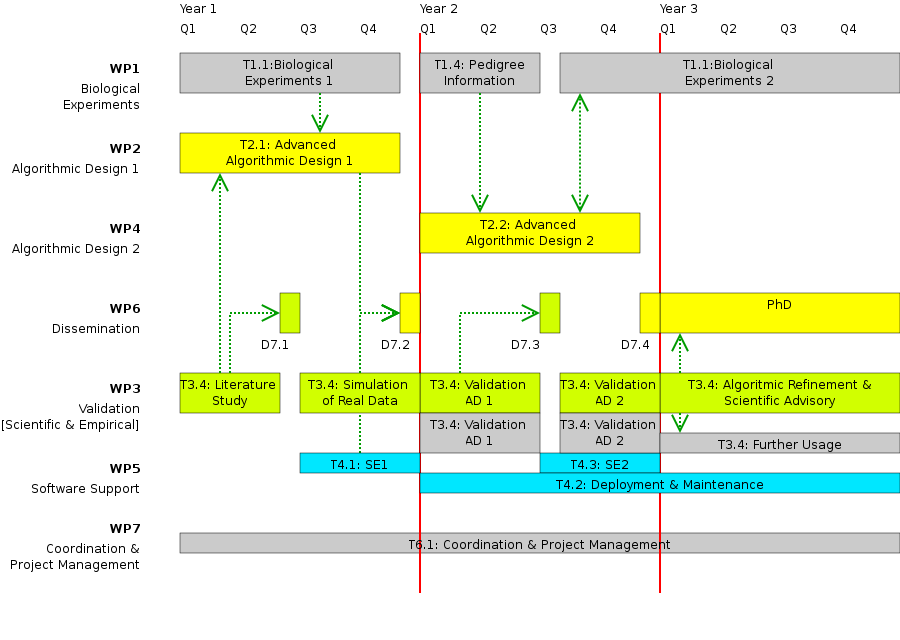
Work Package 1: Biological Experiments
This workpackage is closely related to the project and might offer extra useful documentation. The techniques and experiments described herein will be conducted by Fiskeriforskning.
Genetic map for Atlantic cod: Developing of a genetic map, where the relative chromosomal locations of genetic markers are determined (i.e. a linkage map) is the first step in identifying QTL. Polymorphic QTL can be located using physically linked polymorphic marker loci (Tanksley, 1993). Microsatellite markers seem to be best suited for mapping of QTL due to their hypervariability, and relatively uniform distribution throughout the genome (Dietrich et al., 1992). However, for our purposes of high precision QTL mapping and association with environmental and metabolic effects, it seems likely that high resolution SNP’s will also have to be investigated. Madjid et al. (2003) present some initial results on microsatellite markers in cod.
Gene location and markers: Genetic analysis detects genes only when there is some allelic variation. Even if a character show continous phenotypic variation, the genetic variation may be alleles at a single locus. The specific loci whose allelic differences leading to variation in a quantitative trait- the quantitative trait loci (QTL)- can usually not be individually be identified. Instead one tries to estimate how much variation is accounted by QTL in each region. This can be done by in organisms by crossing two lines that differ markedly in the quantitative trait and which also differ in alleles at well-known loci- the marker genes. The marker genes used for such analysis are such that different genotypes can be distinguished by measurable phenotypic effects that cannot be confused with the quantitative trait. The F₁ resulting the cross between two lines may then be crossed with itself to make segregating F₂, or it may be backcrossed with one of the parental lines. More complicated designs are also possible. If there are QTL's linked with a marker gene then these will be mixed in the segregation generation with the QTL alleles from the parental lines.
Linkage analysis: The localization of QTL's to small regions within the chromosome require closely spaced marker loci along the chromosome. Since marker loci in the parents must differ from each other in the corresponding alleles. One therefore has invented tehcniques that can detect high density of variant loci of genetic polymorhism at DNA level. Especially useful are the restriction fragment length polymorphisms (RFLP's), tandem repeats (microsatellites), and single-nucleotide polymorphism (SNP's) in DNA. Such polymorphisms are so common that any two lines selected for a difference in quantitative traits are also sure to differ from each other at some known molecular marker loci spaced a few crossover units from each other along the chromosome. An experimental protocol for localizing genes uses groups of individuals that differ markedly in the quantitative character of interest as well as at marker loci. These groups may be created by several generations of divergent selection to create extreme lines. One can also take advantage of of existing groups that differ markedly in the trait. These lines must then be surveyed for for marker loci that differ between them. A large number of offspring from the segregating generation are then measured for the quantitative phenotype and characterized for their genotype at the marker loci. How much difference there is in the mean quantititative phenotype between different marker genotypes depends on the strength of the effect of the QTL and on the tightness of linkage between QTL and the marker locus. Statistical analysis and repeated experiments may then be used to uncover the effect of the QTL.
Methods for detection of QTL: Design used to detect QTL in farmed cod vary from experimental backcross and F₂ populations to half-sib designs that use existing family structures within a commercial population. The initial design for detection of QTL will depend on the species which is Atlantic cod and the breeding strategies. The QTL design will influence: a) The implementation of MAS (marker assisted selection) and b) the fine mapping of the QTL. Using a sparse marker map of 10-20 cM several designs have been used to detect QTL regions across the genome in livestock including: experimental crosses and exploiting of existing family structures. Perhaps the most useful tool to quantitative geneticists are dense marker maps- usually constructed from single nucleotide polymorphisms (SNPs) and /or microsatellites. It is these maps that allow for QTL mapping, association studies , and estimation of relatedness between individuals in a random sampling from the population. A complete genome sequence of a sufficiently close species as e.g. Zebra fish can be used as a Rosetta stone for identifying candidate genes. With a genome sequence one can construct microarrays of a large number of chosen DNA sequences for looking at gene expression in particular tissues and probing the related genome for homologous genes. Chips can also be used to rapidly genotype individuals at literally tens of thousands of SNP sites. Also a fraction of microsatellite markers found in a related genome may extend over to cod. Obvious candidates for microsatellite markers can be chosen from sequence data. Likewise a DNA chip from a model organism can be used to extract homologous genes of interest. Subtraction methods allow the genomic sequence of one organism relative to a target model to be extracted or enriched.
Work Package 2: Advanced Algorithmic Design 1
QTL analysis method: Understanding and estimating the structure and parameters associated with the genetic architecture of quantitative traits is a central theme in quantitative genetics. With the availability of well-saturated genetic maps of high-throughput genetic markers of SNP's and microsatellites and use of bioinformatical data and simulations , it is possible to identify a major part of the structure of the genetic architecture of quantitative traits described in terms of linkage, dominance, and epistasis, number of genomic positions, effects and interactions of significant QTL and their contribution to the genetic variance. With the multiple traits and multiple environments involved in a QTL mapping experiment, pleiotropic effects and QTL environment interactions can also be estimated.
There are however a number of challenges. The first being the very complex nature of the cod genome (as explained in section 2). Secondly, since the genotypes of an individual at many genomic locations are not observed, but marker phenotypes are, the model will contain missing data. To fill in these holes inference needs to be done about the QTL positions and the corresponding genetic parameters and architecture. We develop a Bayesian mixture model (Here we will need M. Figueiredo’s expert knowledge of Bayesian modelling and codelengths for mixture models. See also T. Flå’s reports on the subject) and develop estimators and codelengths and also seek to optimize the parameter space dimensions by minimizing the codelength (model selection).
Work Package 3: Validation
Literature Study: an extensive literature study will be performed in this workpackage.
Simulation: In this task we will investigate the created models by means of simulating genetic data. The purpose of simulation is to create data (in the absence of the actual data) that can be used for QTL detection. Simulation data can be used to test the ”feasibility” of our statistical models. That is to check the performance of the models or methods. We cannot verify the performance of the models by using the actual data because the true parameters of the model are unknown. Simulations will be done from specified distributions of the genotype and phenotype. Methods of the above simulations include inversion method, rejection sampling, ratio of uniforms etc. (Stuart & Gareth (2001)). The simulated data will also be used to check the performance of the models or methods that we will develop. One of the methods used for QTL detection is the Bayesian method. Here simulation methods like MCMC are commonly used to evaluate complex integrals to summarize the posterior distributions. More information about this can be found in the appendix which explains Markov Chain Monte Carlo Simulations and the recently developed Reversible Jump techniques.
Empirical Validation: after verifying our models based on a simulation, we will deploy the software and test the algorithms empirically on data provided by the FiskeriForskning.
Work Package 4: Advanced Algorithmic Design 2
Selective genotyping: The largest cost in QTL mapping experiments is the cost of genotyping individual animals (for us cod) at the DNA markers. Selective genotyping is a strategy to reduce this cost by genotyping only individuals from the high and low phenotypic tails of the trait distribution in the population (Darvasi and Soller, 1992). In half sib designs, the selective genotyping is done such that each sire family there will be a high and low progeny group. Individuals with extreme deviation from the mean are most informative for linkage and inference of genotypes from phenotypes. It is recommended that the selection is not lower than the 10% quantile in either tail (Bovenhuis and Meuwissen, 1996) because of problems with possible outliers in the phenotype data. One drawback with selective genotyping is that the estimated QTL effects is severely biased (upwards) if only genotyped individuals are used to estimate the effect (Darvasi and Soller, 1992) which will erode the advantage of using the marker information in MAS. Darvasi and Soller(1992) suggested a method to avoid this by deriving the actual QTL effect as a function of the observed effect and the selection fraction. To create even larger reduction of genotyping costs by the O(100) in large populations, it has now become common to create DNA pools from the tail distributions and assess the main genotype characteristics from these pools.
Pedigree and phenotype information: An alternative strategy to reduce genotyping costs is to include pedigree and phenotype information from the ungenotyped animals as constraints in a variance component analysis. An identical by descent (IBD) matrix tracing the inheritance of sire alleles to progeny is constructed. Ungenotyped animals are given probability of 0.5 of inheriting either sire QTL allele which can be placed in a design matrix. This method has given unbiased estimates of the QTL variance in simulations. Large-scale successful experiments require these methods. We therefore envisage such extensions in future proposals which require careful collaboration between theoreticians and the breeding/laboratory experiment. The experimental data that will be used as input to this workpackage is related to an existing project, that is a collaboration between fiskeriforskning and Norut IT.
Work Package 5: Software Engineering & Maintainance
In order to ensure applicable algorithms for fiskeriforskning, Norut IT will develop the software, follow up its maintainance and support it. A database and accesspoints onto the database will devlopped. The challenge here is to create a databasemodel that is suitable to use in conjunction with mathematical and statistical techniques.
Work Package 6: Dissemination
5.Related Work
Successful design of breeding experiments: In a recent article Grisart et al. (2002) reported the identification of a single base pair mutation in the DGAT1 gene with major effects on milk yield and composition in cattle. The first in such an identification of the mutation was a genome wide linkage analysis (genome scan) which found a region of chromosome 14 which contained a QTL with large effect on fat percentage. The confidence region surrounding the QTL was 20-40cM. The confidence region surrounding the QTL was narrowed to 3cM by using linkage disequilibrium mapping (LD) and combined linkage disequilibrium linkage analysis (LDLA) (Farnir et al., 2002). Subsequent sequencing detected a base pair mutation in this gene which could be associated with major effects on milk yield. We expect most QTL's in cod to have smaller effects than this, making the identification of the underlying mutations even more difficult. However the availability of Rosetta stone genomes like Zebra fish, the future sequencing of the cod genome and the accessibility of genomic biomarkers like SNP's, microsatellites and expression biomarkers like differential proteomics and microarrays, could mean that possible mutations underlying variations in relatively weak multiple traits in cod could be identified within the next 5-10 years. We certainly plan to use similar techniques to diminish the confidence regions of cod multiple QTL's and design breeding principles accustomed to the cod genome. However, the above discussion emphasize the need to develop QTL analysis techniques including environmental and epistastis effects as a first step.
6.Participants
The project management will be done by Dr. Madjid Delghandi. The management will cover coordination of work between the participating organisations, management of budget, progress reporting, project meeting and public relation work. A responsible will be assigned to each work package. Project communication will mainly be based on e-mail. Project meetings will be arranged when needed. The participating organisations and principal project personnel are listed below. Prof. Dr. Tor Flå will be responsible for the day to day management of the project, including scientific advising and promoting of the involved persons.
Fiskeriforskning performs research and development work for the fishery and aquaculture industry. The Institute covers all links in the value chain. Fiskeriforskning contributes towards development and commercialisation of High quality seafood, Aquaculture species of interest, Biotechnological products and Technological solutions. Fiskeriforskning has as an objective to perform research and development work that will result in a competitive fishery and aquaculture industry and a best possible utilisation of the sea’s resources. In addition, advisory services to authorities and industry participants, as well as communication of knowledge and research results to the industry and the public are central tasks. Fiskeriforskning’s expert competence covers the areas of aquaculture, raw materials, processing, product and market. The Institute’s strength lies in the combination of an overall understanding and top professional competence on an international level within these key fields.
Dr. Madjid Delghandi is an expert on microsatellites and QTL analysis. He is responsible for the molecular genetic part of the national cod breeding program currently running at Fiskeriforskning. He has recently initiated paternity testing in cod. He will lead the implementation of the whole project. He will in the frame of this proposal, identify microsatellites, create a BAC library, screen it for genes known to be involved in traits of interest, create a low resolution linkage map and analyse the QTL in Atlantic cod. The data will be stored and the map will be accessible through website for the cod map.
NORUT IT is an applied research institute in the field of information technology, telematics applications and earth observation science. NORUT IT employs 25 research scientists and administrative personnel. NORUT IT's information technology research focuses on geographical information network, distributed multimedia applications, data communication, and object oriented methods for data modelling, system development, internet and web applications. Main research areas within earth observation are optical and microwave remote sensing, pattern recognition, image processing and multivariate data analysis. NORUT IT has had a strategic institute program sponsored by The Research Council of Norway, called GIN, running from 1999 through 2002 (Project 127586/420). The programme explores 1) the usage of several very large interconnected spatial databases for storing, accessing and maintaining seamless and multiscale representation of geographical data. 2) The construction and composition of software components that build maps for display or analysis by obtaining geodata from various sources. 3) The process of deriving information from satellite data, as automatic as possible. The experience from this research on large amounts of heterogeneous data will be used in the construction of the databases described in this project proposal. NORUT IT has since 1984 had a wide range of research projects on environmental and resource monitoring by the use of radar and optical satellite remote sensing. The experience of structuring and extracting useful information from large amounts of complex multivariate spatial data by the use of techniques such as pattern recognition, statistical methods, physical modelling as well as multivariate data analysis, will be transferred to the field of bioinformatics. NORUT IT has over the last years build up competence in bioinformatics, particular in building databases for sequence and structure data and dataanalysis algorithms.
Dr. Werner Van Belle is a research scientist at NORUT IT. His main expertise lies in the development of distributed systems and architectures for mobile multi agent systems. He received his doctoral degree in 2003 at Brussels University. His doctoral work covers the formal analysis of interoperability conflicts and automatic resolution of them within the context of open distributed systems.
Said H.Ahmed completed his Siv.ing. in applied physics in 2000 at Tromsø’s University. He currently works as a research scientist at Norut IT. His expertise lies in areas of datamining in bioinformatics, multivariate statistical analysis and numerical methods, pattern recognition in image processing and signal analysis.
MatNat
We need a description of the MathNat departement
Prof. Dr. Tor Flå was born (huray ?)
Cigene is the national centre for integrative genomics in Norway, and have core facilities for running a national service for detection, typing and interpretation of SNPs. It also have as mandate to among other areas to establish key competence concerning identification of experimental and theoretical approaches for making a causal connection between genomic and phenotypic data on complex traits in fish. They also have taken special interest in causal modeling and regulatory processes connected to analysis of QTL. Our project therefore fits in very nicely since we will do complementary research for environmental and metabolic effects connected to QTL analysis of cod and MAS of cod. Therefore we will put in efforts to joint collaboration and establish a research network with Cigene by a) positioning our phd and postdoc students each at least 4 weeks a year on Cigene for joint collaboration, seminars and PhD level courses. b) organizing joint seminars between Cigene and our group. c) collaborate on making use of microsatellite and SNP data for 1) performing and developing multi-trait LD/linkage analysis for cod in close collaboration with Cigene, 2) identifying and validating regulatory networks by Bayesian causal inference and modeling tools for cod. Furthermore we plan to write joint papers in the above fields.
Prof. S. Omholt, Director of the Cigene, Fuge-platform for Integrated Genetics, NLH, Ås.
International Participants
Prof. T. Koski, Mathematical statistics , Linkøping University and 25% position at Rolf Nevanlinna Institute, University of Helsinki. Expert in Bayesian and Markov models in bioinformatics and author of a book in this area.
Prof. M. Figueiredo, Department of Electrical and Computer Engineering, Instituto Superior Técnico (IST). Leading expert in model selection and Bayesian mixture models. Author of several books and editor of several international journals.
7.Relevance
The results of this project are important for the cod genome project and could contribute, firstly, to the better understanding of the genome of "Atlantic cod", secondly, for direct use in study of "QTLs" in the same species. In effect, it will also ensure quality traits for farmed fish.
Furthermore, our MAS project may contribute to remove the following bottlenecks in cod acquaculture:
-
Develop strategies for feeding cod to enhance product yield, growth, feed conversion and product quality
-
Establish sensitive indicators for environmental preferences for farmed cod
- Establish new strategies for selective breeding for increased productivity by developing rapid genotyping methods and to use QTL studies to identify genomic regions for traits of interest
8.Ethic and Environmental Aspects
We do not see any possibility that ethical questions can be raised against the proposed research activities and it is not considered to have any negative effects on the environment.
9.Finances
The direct costs will mainly be used to cover for travel expenses for contact with international partners. This is especially important for the PhD, PostDoc and their advisors. The external budget covers a) experiments that are and will be done by Fiskeriforskning and b) the involvement of the departement of mathematics.
10.References
- Tanksley,S.D. (1993). Mapping polygenes. Annual Review of Genetics 27, 205-233.
- Dietrich,W., Katz,H., Lincoln,S.E., Shin,H.S., Friedman,J., Dracopoli, N.C., and Lander,E.S. (1992). A genetic-map of the mouse suitable for typing intraspecific crosses. Genetics 131, 423-447.
- Edwards, K.J., Barker, J.H., Daly, A., Jones, C., and Karp, A. (1996). Microsatellite libraries enriched for several microsatellite sequences in plants. Biotechniques 20(5),758-60.
- Delghandi, M., Mortensen, A., and Westgaard, J.-I. (2003), Simultanous analysis of six microsatellite markers in Atlantic cod (Gadus morhua): A novel multiplex assay for use in selective breeding studies. Mar. Biotechnol. 5, 141.
- Knott, S.A. and Haley, C.S. Genetics 2000, 156, 899.
- Sillanpää, M.J. and Corander, J. , (2002), Trends in Genetics 18, 301.
- Richardson, S. and Green, P.J. (1997). On Bayesian analysis of mixtures with an unknown number of components. J. Roy. Stat. Soc. B 62(1), 57.
- Ntzoufras, I. (1999). Aspects of Bayesian model and variable selection using MCMC. Ph. D. Thesis, Department of Statistics, Athens, Greece.
- Yi, N. , Xu, S., and Allison, D.B. (2003). Bayesian model choice and search strategies for mapping interacting quantitiative trait loci. Genetics 165, 867.
- Population Genetics & Fishery Management, ed.'s Ryman, N. and Utter, F., Washington Sea Grant Program, University of Washington Press, Seattle – 1987.
- Hoffman, A.A. and Parsons, Evolutionary Genetics and Environmental Stress, Oxford University Press, Oxford- 1991.
- Churchill, G.A. and Doerge, R.W.(1994), Empirical threshold values for quantitative trait mapping, genetics 138, 963.
- Sen, S. and Churchill, G.A. (2001). A statistical framework for quantitative trait mapping, Genetics 159, 371.
- Zeng, Z.-B., Kao,C.-H. and Basten, C.J.(1999). Estimating the genetic architecture of quantitative traits. Genet. Res., Camb. 74, 279.
- Bovenhuis, H. and Meuwissen, T. (1996). Course detection and mapping of quantitative trait loci, 16-19 april, University of New England, Armidale, NSW, Australia.
- Darvasi, A. and Soller, M.(1992). Selective genotyping for determination of linkage between a marker locus and a quantitative trait locus. Theoretical and applied genetics 85, 353.
- Grisart, B. et al. (2001). Genome Research 12, 222.
- Farnir, F. et al. (2002). Genetics 161, 275.
- Flå, T. (2004a) Feature variables and model selection for biolinformatical data, Lecture notes 2004 for mat-3211, Bioinformatics. http-link This link should be fixed !!!
- Flå, T. (2004b). Analysis methods for QTL in cod. Internal Report. IMS, MatNat, University of Tromsø http-link…. This link should be fixed !!!
- Fossgard, E. (May 2004) , An invariant Bayesian model selection principle for Gaussian data in a sparse representation. Ph. D. Thesis at IMS, Faculty of Science, University of Tromsø . Advisor: T. Flå.
- Stuart Coles, Gareth Roberts and Soren Jarner; Computer Intensive Methods, January 14 2001.
Appendix A: Mathematical Background
-
Epistasis and Incompleteness of Models
With the multiple traits and multiple environments involved in a QTL mapping experiment, pleiotropic effects and QTL environment interactions can also be estimated.
Epistasis and more complicated design and multiple trait effects, dictates the search for, and mapping of multiple epistatic QTL need to be performed at multiple intervals simultanously by the multiple interval mapping(MIM) method (Zeng et al. (1999)).The idea of MIM is to fit multiple putative QTL effects and associated epistatic effects directly in a model to facilitate the search, test and estimation of positions, effects and interactions of multiple QTL. MIM thus combines the QTL mapping analysis with the genetic architecture of quantitative traits.
. Since the genotypes of an individual at many genomic locations are not observed, but marker phenotypes are, the model contains missing data. The likelihood function of the data given by the model is a mixture of normal distributions over the K=2m possible combinations of choosing QTL/ non-QTL at m genomic positions.
Suppose for example that we have data on n cod fish derived from the simple breeding design of an inbred line cross. Denote the quantitative trait measurements by y=(y₁,y₂,...,yn)′ and denote the genotyping data by the n×k matrix M=(Mij), where the rows correspond to markers for each individual cod. The quantities y and M are the observed data. We now assume that the chromosome of origin, order, and genetic distance between the markers is known. In practice, there often exists good estimates of these quantities.The genetic model, H, is a description of the distribution of phenotypes given the QTL genotypes. If there are p contributing QTL and the trait values are normally distributed within the QTL genotype classes, a general linear model may be used to describe the relationships of the phenotype to the QTL genotypes. The parameters of the of the genetic model are denote by μ =(μj). The locations of the QTL are denoted by the p-dimensional vector λ. The QTL genotypes are denoted by the n×p matrix g=(gij) where rows correspond to individuals and columns to loci. These quantities μ, λ, and g are the unobserved data which has to be estimated with reference to the data given a model.
The goal is to make inference about the QTL positions and the corresponding genetic parameters and architecture . We develop a Bayesian mixture model (Here we will need M. Figueiredo’s expert knowledge of Bayesian modelling and codelengths for weakly interacting mixture models. See also T. Flå’s reports on the subject) and develop estimators and codelengths and also seek to optimize the parameter space dimensions by minimizing the codelength. Under the assumption that the joint distribution of the trait measurements and the genotype data are independent, we obtain a simple factorization which depending on linkage structure and breeding program can be worked out to different DAG structures . These results can then be used as an efficient independent procedure to estimate multiple QTL positions and their genetic architecture or as input to simplifying model selection steps in the reversible jump
-
Bayesian QTL analysis and reversible jump MCMC simulations
In agreement with Sillanpää and Corander(2002) we will use a DAG (Directed Acyclic Graph) to systematize the genetic architecture and prior information and the analysis necessary to develop viable algorithms for inference on multiple QTL's with a genetic architecture. We propose however to intoduce a reversible MCMC approach for normal mixtures (See Flå (2004a,b)) for the purpose of more realistic distributions needed for high resolution (O(cM)) multiple QTL analysis for cod. For large enough data samples, we will after careful comparisons with such simulations switch to our codelength model selection principles to reduce analysis complexity. Also our asymptotic codelength methods can be used as a test for the applicability of the Bayesian models and priors in question. We will have access to Sillanpää’s et al. competence in this area through Prof. T. Koski's affiliation with this group.
The types of models considered first has to be decided depending on the genetic problem and the type and resolution of the data (marker type and resolution). In addition one has to include priors for the model space and dimension and values of the model parameters. This includes priors reflecting the number of influential genes (QTLs) and to their effects and their sensitivity towards small gene effects. The priors assigned to the locations and gene effects are often weakly informative. We will use variable dimensional modelling and Reversible jump Markov Chain Monte Carlo (MCMC) where several genetic models are visited during simulation. In agreement with Xi et al. (2003), we propose to use a stochastic decision procedure or switch('jump') between model dimensions corresponding to different number of QTLs during simulation. This algorithm has the possibility to include environmental eand epistasis effects, but is not based on mixture of normal distributions. Reversible jump MCMC for Mixture of normal distributions in the context of clustering for unknown number of cluster labels, has been discussed by Richardson and Green(1997). In Flå (2004a,b) this is extended to more general labels like genetic architectures for multiple QTL including environmental and epistasis effects. We also give a discussion of reversible jump MCMC algorithms in the limit of weakly overlapping mixtures and large and moderately large sample sizes.
. The MCMC samplers require careful monitoring of the convergence and mixing properties of the MCMC sampler. The numerical estimation of posteriors in full Bayesian inference is computationally intensive even for moderately large n, but in this limit we intend to switch to the asymptotic model averaging technique to calculate the predictive distributions needed in the evaluation of the posteriors(See Flå(2004a,b) and Ntzoufras(1999) for several strategies of model selection for for reversible jump MCMC). The evaluation and dimensional optimization of these predictive distributions correspond to the construction of our invariant codelength principles and their dimensional optimization for large data size n. Here it has to noted that the optimization of the codelengths for simple, independent likelihoods can be done by first optimizing the QTL model dimension for each type of QTL and then a sorting procedure corresponding to the robust part of the data fed to the estimators. This give a O(nlog n) complexity of optimization in simple cases. While this is not in generally true in a Bayesian DAG structure, one can expect that low-complexity procedures can be made by mapping to near independent, possibly multiple representations.
-
Theoretical foundation of the QTL analysis methods
The idea of MIM is to fit multiple putative QTL effects and associated epistatic effects directly in a model to facilitate the search, test and estimation of positions, effects and interactions of multiple QTL. MIM thus combines the QTL mapping analysis with the genetic architecture of quantitative traits. Since the genotypes of an individual at many genomic locations are not observed, but marker phenotypes are, the model contains missing data. The likelihood funtion of the data given by the model is a mixture of normal distributions over the K= 2m possible combinations of choosing QTL/ non-QTL at the m genomic positions.
L(E,μ,σ²∣Y,X)=∏ni =1[∑Kj=1pijφ(yi∣μj,σ²) , μj =μ+DjE include in principle all the above genetic architectures.Here the term in the square brackets is the weighted sum of normal density functions , one for each of the K possible multiple-QTL genotypes. pij is the probability of each multilocus genotype conditioned on the marker data, and φ(yi∣μj,σ²) denotes a normal density function with mean μj and variance σ².
Under for example the simplifying assumption that the joint distribution of the trait measurements and the genotype data are independent, we obtain a facorization which lead to the LPD-score model below
p(y,M,g,μ.λ) = p(y∣M,g,μ,λ)p(M,g,μ,λ)=
p(y ∣ g,μ)p(μ)p(g∣M,λ)p(M)p(λ)
Estimating the
QTL locations by a pseudomarker and invariant Laplacian method
We want to consider models with multiple QTL, including cases in which there is linkage and/or interaction among the QTL. We can generate genotypes on a discrete grid of locations spanning the genome, which we refer to as the pseudomarker grid. For a given p -tuple of pseudomarker locations u=(u1,....,up), the i'th realization of the genotypes is an n×p matrix denoted ri(u). In interval mapping, inference about QTL locations is based on likelihood-ratio tests expressed on the scale of base 10 logarithms at the ML-estimator of the genetic model parameters μ. The LOD score at QTL location λ , will in our model be given by LOD(λ)=constan t+log₁₀(sup_{μ}(p(y,M∣μ,λ)). We follow Sen & Churchill(2001) and suggest to optimize the posterior distribution of the QTL locations
LPD(λ) = log₁₀(p(λ∣y,M)=constant+log₁₀(p(y,M∣λ))+log₁₀(p(λ)),
p(y,M ∣ λ)=∫ p(y,M∣μ,λ)p(μ)dμ,
p(y,M,λ) ≈ ∑qi=1WH(ri()) gives a Monte Carlo aproximation
We observe that the LOD score can be seen as the log₁₀-likelihood of the conditional probability at the corresponding ML-estimator the genetic model parameters μML. We have shown how the integral due to marginalization in the LPD-score can be evaluated asymptotically for large enough dimension of data (y,M) by an invariant estimator μ∗ which to lowest order is biasfree with respect to the posterior density. Again to lowest order we have shown that a candidate for codelength is L₁(k₁)=-log₂(p(y,M∣λ))=
-log₂((2π) {k₁/2}p(y,M∣μ∗,λ)p(μ∗)/∣H₁(μ∗)∣1/2) with and extra term to take into account the model description. Here H₁ is the Hessian described in the invariant Laplacian approach given by Fossgaard and Flå (2003), Fossgaard(2004). The upshot is that it is possible to optimize the model size k₁ which in this case correspond to the dimension of the model parameterspace of μ and find the the corresponding marker positions contributing.
For us the pseudomarker grid is discrete with a discretization δλ of the order of a few cM. Therefore the region of highest posterior density (HPD) can be found in a straightforward way.
Bayesian analysis of multilocus association
We present a model which selects a trait-associated subset of markers. Both quantitative and qualitative (categorical which here is binary) traits can can be analyzed and genetic markers can be either bi- or multiallelic type .We can now give the following overview of the reversible jump MCMC algorithm (see Yi et al.( 2003) for details):
- Update the missing marker genotypes and phenotypic values
- Update the model parameters
- Update the genotypic indicators
- Update the locations of QTL
- Update the QTL effect indicator (γ): add or delete a main or epistatic effect
- Add one new QTL with main effect or epistatic effects between existing QTL, or delete an existing QTL.
- Add two new QTL with only an epistatic effect between themselves, or delete two existing QTL
Deleting an effect and deleting one or two QTL from the model may result in that some QTL have all corresponding effect indicators to zero. If it occurs, we remove such QTL from the model. A complete pass through the above steps is called a sampling iteration. The algorithm starts from initial values of unknowns and updates these until a criterion of convergence is reached. The posterior samples are then random drawings from the joint posterior distribution which might be used to draw inferences about parameters of interest. Except for the effect indicator vector (γ) and number of QTLs (l). other unknowns does not result in a change of parameter space dimension. These unknowns can be updated by the ordinary Metropolis- Hastings method. Conditional on other unknowns, updating the effect indicator variable is a variable selection problem and a variety of model selection methods including the codelengths we have derived can be applied to update γ. A simple reversible jump MCMC algorithm is the following:
∙ The total number of elements in the vector γ is l(l+1)/2 including l main effects and l(l-1)/2 digenic epistasis.
Then update by randomly select one of all l(l+1)/2 elements.
∙ Propose a change for this element (γ→γ′). If the element associated with epistasis between QTL q₁ and q₂ is selected then γq₁q₂′=1-γq₁q₂. In other words we only accept changes which are not already included.
∙ Accept or reject the proposal according to the reversible jump MCMC method .
| http://werner.yellowcouch.org/ werner@yellowcouch.org |  |