| Home | Papers | Reports | Projects | Code Fragments | Dissertations | Presentations | Posters | Proposals | Lectures given | Course notes |
|
|
Artefacts in the Mass Spectra Output from MALDI-TOF and MALDI-TOF/TOF MachinesWerner Van Belle1* - werner@yellowcouch.org, werner.van.belle@gmail.com Abstract : MALDI-TOF mass spectrometry is a well known and widely used technique to fingerprint and sequence proteins. A carefull investigation of the mass spectra output from unnamed machines shows a number of artefacts produced by the machines themselves. Because these artefacts complicate a number of procedures we present a number of preliminary techniques we developed to get rid of most of the artefacts.
Keywords:
matrix assisten laser desorption ionisation MALDI time of flight TOF artefacts noise |
Table Of Contents
Introduction
In MALDI-TOF (Matrix assisted laser desorption ionization) a sample
is mixed with a matrix. When this mixture dries it forms crystals.
When such a crystallized mixture is targeted with a high energy laser
beam with the correct wavelength, the matrix itself will suddenly
absorb the incoming energy and heat up. This rapid heating causes
sublimation of the matrix and subsequent expansion of the molecules
co-crystallized within the matrix. The ions are then accelerated using
a strong electrical field and thus separated based on their ![]() ratio. The ions can then be detected at the end of the tube, or
reflected
and then be detected. This (optional) reflection phase increases the
accuracy of the technique substantially.
ratio. The ions can then be detected at the end of the tube, or
reflected
and then be detected. This (optional) reflection phase increases the
accuracy of the technique substantially.
In a typical proteomics setup a mass spectrogram is taken, the peaks are selected and then used to fingerprint proteins. Some machines offer the possibility to use an advanced lift system which makes it possible to measure the mass of the (poly)peptides within a larger fragment of a specific weight. This makes sequencing of proteins possible.
Artefacts
We performed a number of measurements on different mass spectrometers. Surprisingly, the output from these machines contains a number of artifacts, which were also present on machines located at other sites, such as the Flemish Biotechnology Center and freely published online spectra.
We believe that these artifacts complicate a number of possible uses of those machines
- Some of the artifacts might actually shift peaks a little
backward
or forward over the
 axis.
axis. - The artifacts make it difficult to automatically select smaller peaks. E.g; when the noise level is close to the peak level, a human expert is able to select these, however a computer is unable to do so as long as the data is noise filled. This might be important for fingerprinting multi protein complexes.
- Some of the artifacts have signal levels which might even exceed the actual signal.
Tones in Reflection Mode
 Artefacts in a typical mass spectrometry using the reflection mode.
|
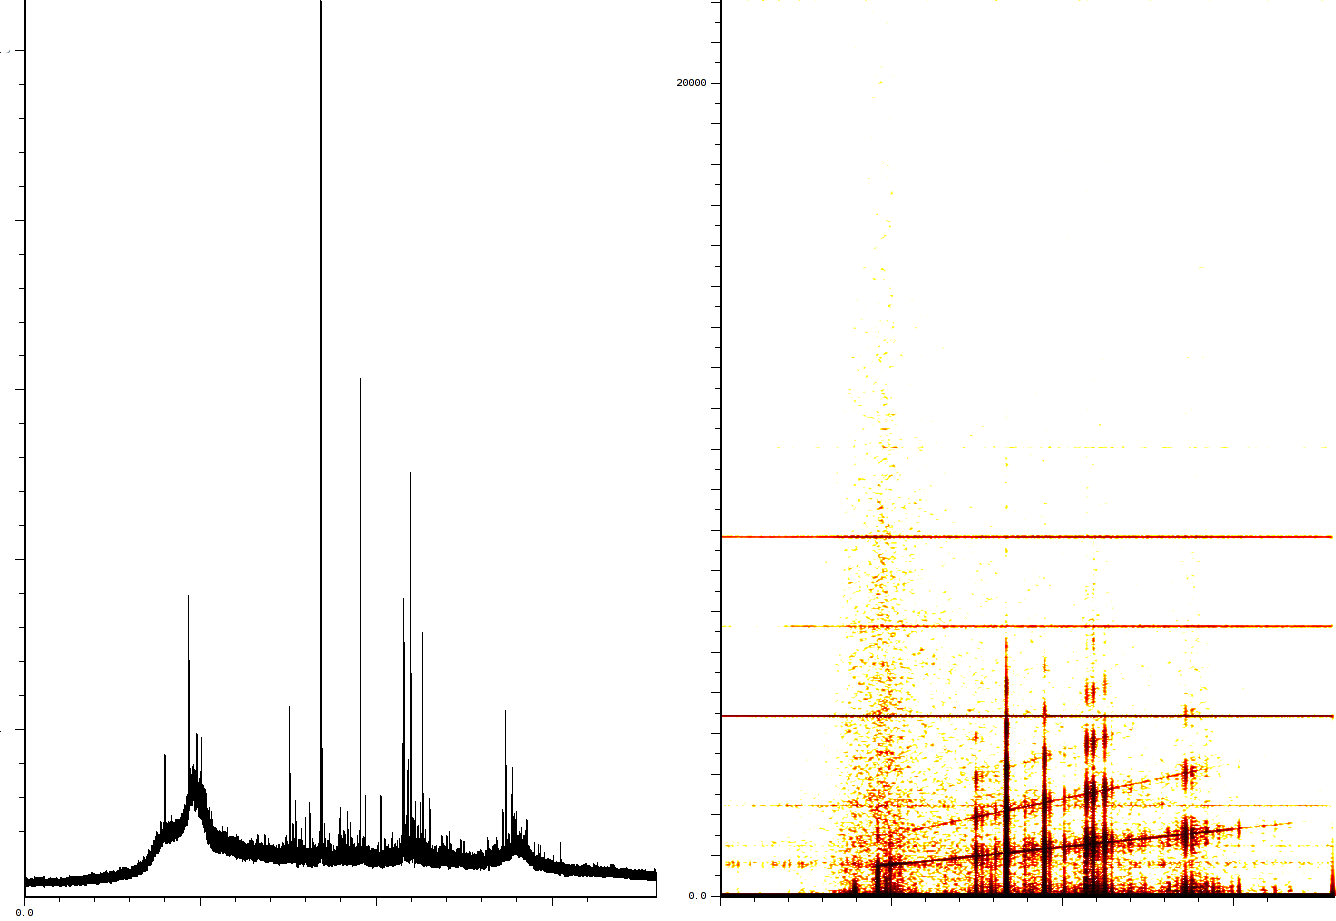
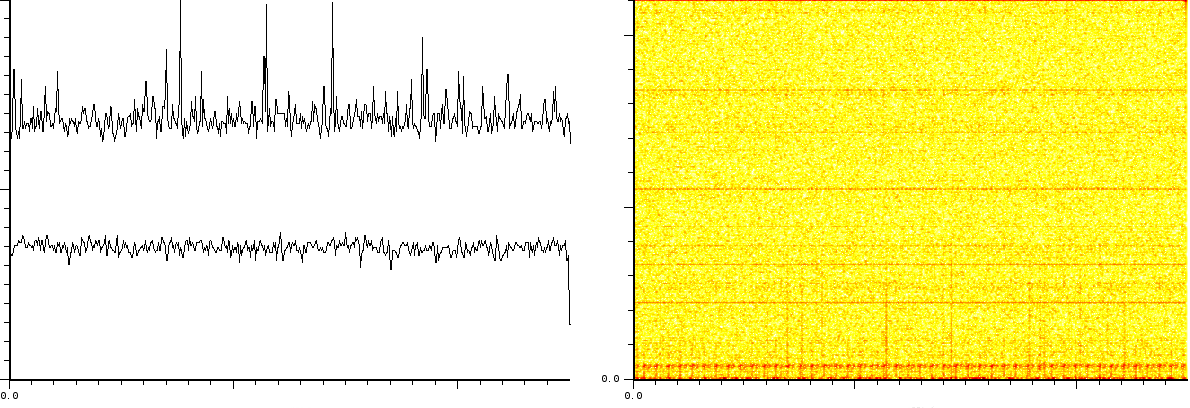
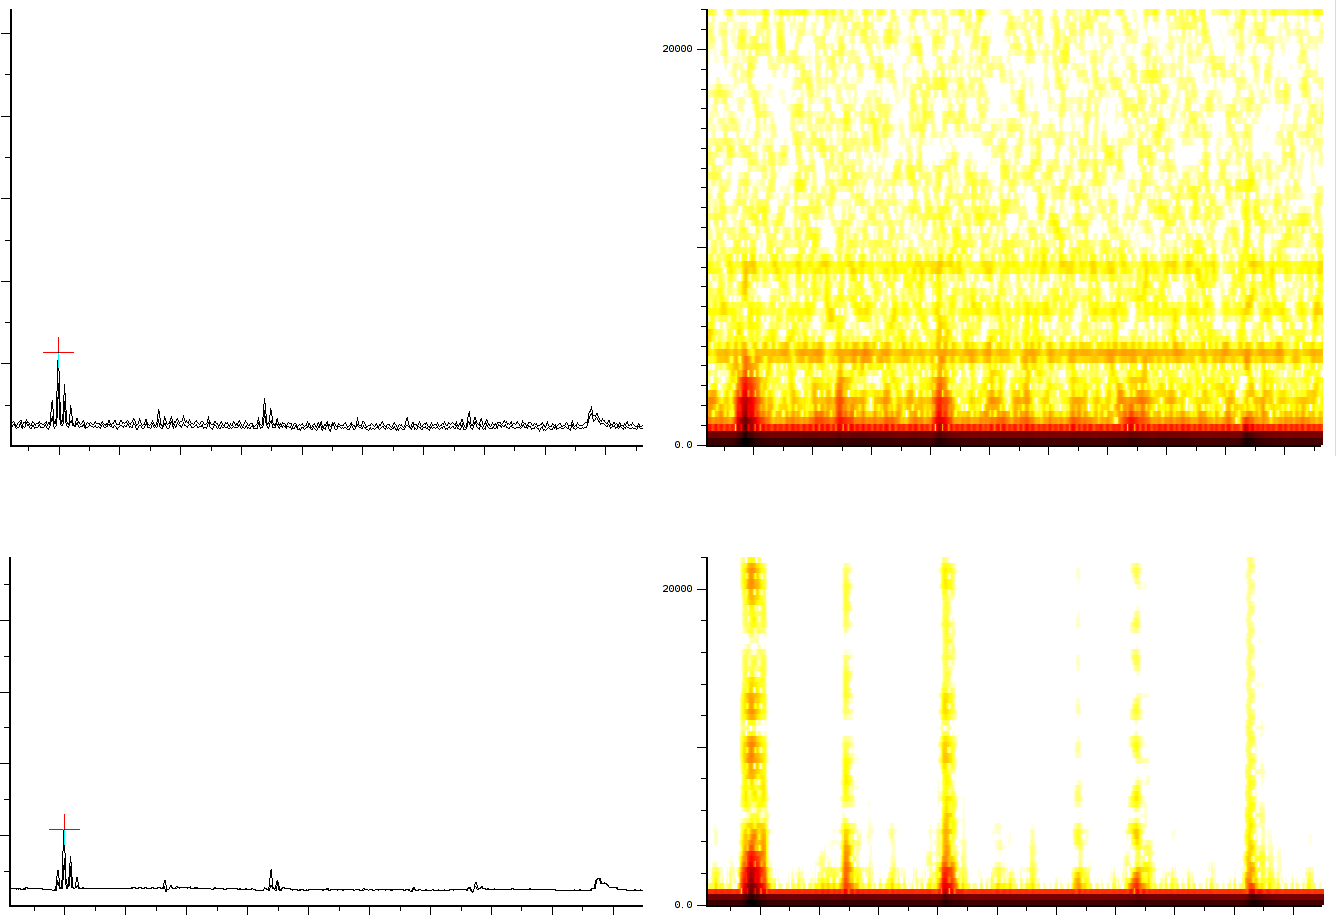
The first experiment concerns the typical fingerprinting of a protein. In this experiment the reflection mode was turned on. The mass spectrum output consist of 158548 samples between 100.003 and 4019.170 Da. The window size of the SFFT is 2048 samples, which forms a good compromise between frequency-accuracy and position accuracy. In all the figures we present, both the m/z axis and the energy axis have been normalized. The frequency analysis has also been normalized and is shown in dB.
This experiment (figure ![]() ) clearly shows
) clearly shows
- 3 static tones superimposed over the signal (these are the three horizontal lines), as well as
- 3 linear upward sweeping tones (the three slightly upward slanted lines).
- a burst of noise shortly after the deflection mode of the machine.
Decaying tones in Lift
 Noise of the Lift Spectrum
|
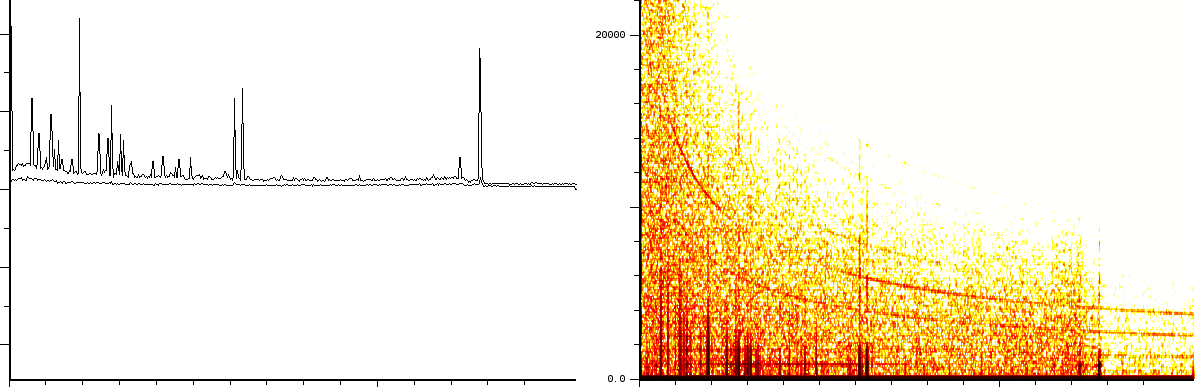
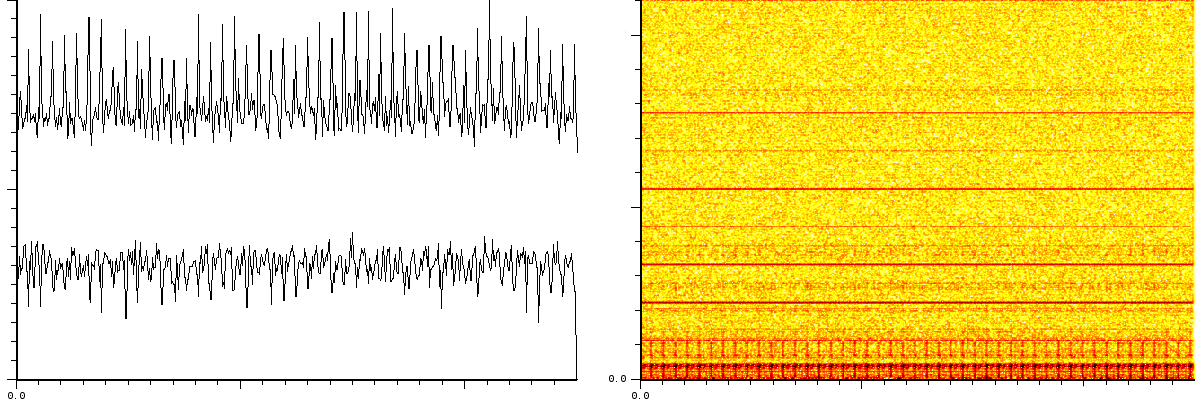
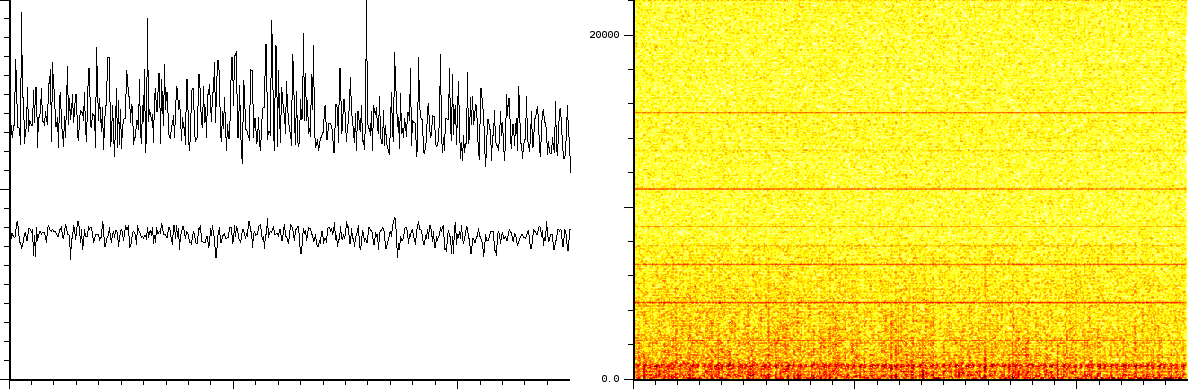
In a second experiment we measured the lift of a peak using a
MALDI-TOF/TOF
machine. The mixture contained a protein-fragment which was to be
sequenced. The output from the machine ranges from 20.067 till
1264.626,
in 67873 samples. Again, the m/z, energy and frequency content are
all three normalized. The frequency analysis (figure ![]() )
shows
)
shows
- 2/3 static tones at a low frequency
- 2/3 decaying tones which start at a high frequency and decay exponentially.
Lineair Mode
| ||||
| Noise in lineair mode |
| ||||
| Noise in lineair mode |
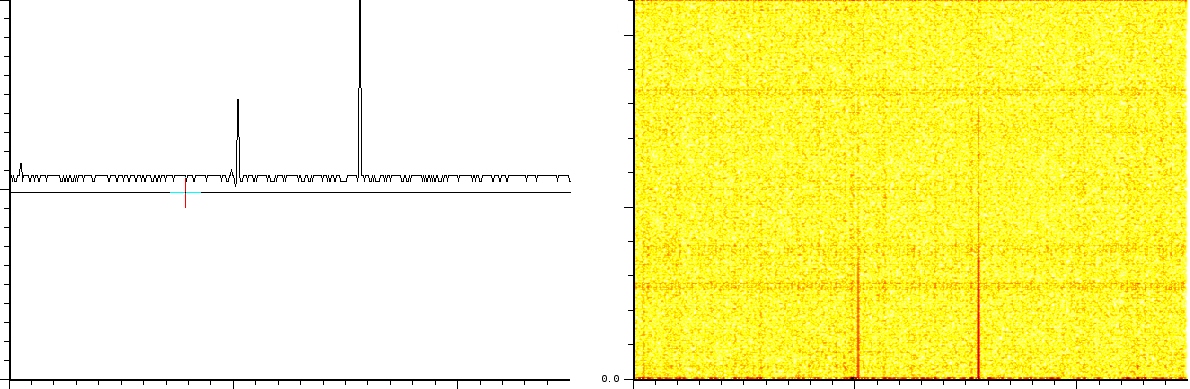
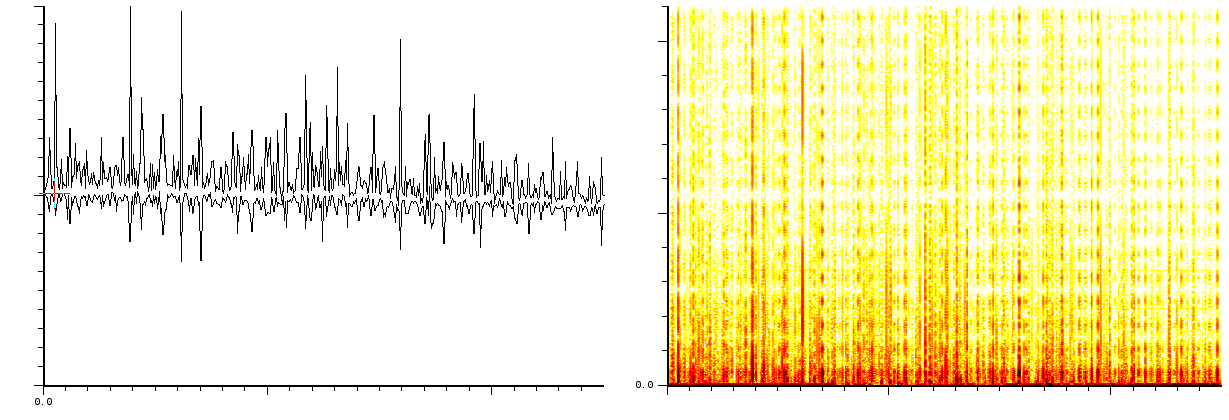
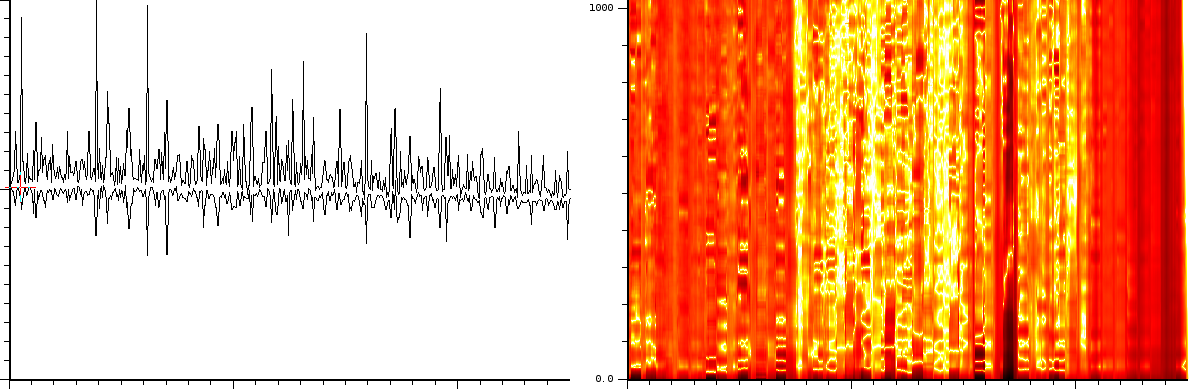
In a third experiment we measured the pure noise output of a MALDI
machine in linear mode. The output shown in figures ![]() and
and
![]() covers 110296 samples between 40 kDa and 80kDa. During
the experiment, the laser was switched off, as such we measure only
the noise generated by the machine. The artifacts we now observed
were even more interesting then the previous ones.
covers 110296 samples between 40 kDa and 80kDa. During
the experiment, the laser was switched off, as such we measure only
the noise generated by the machine. The artifacts we now observed
were even more interesting then the previous ones.
- White noise, as could have been expected. Please note here that this is with the laser turned off and as such it does not say anything about the signal/noise ratio.
- A probabilistic distribution of pulses.
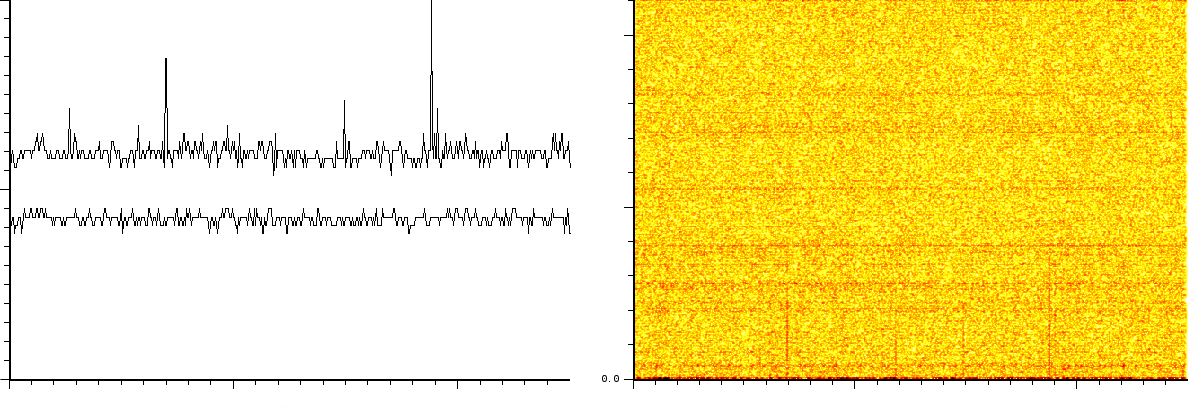
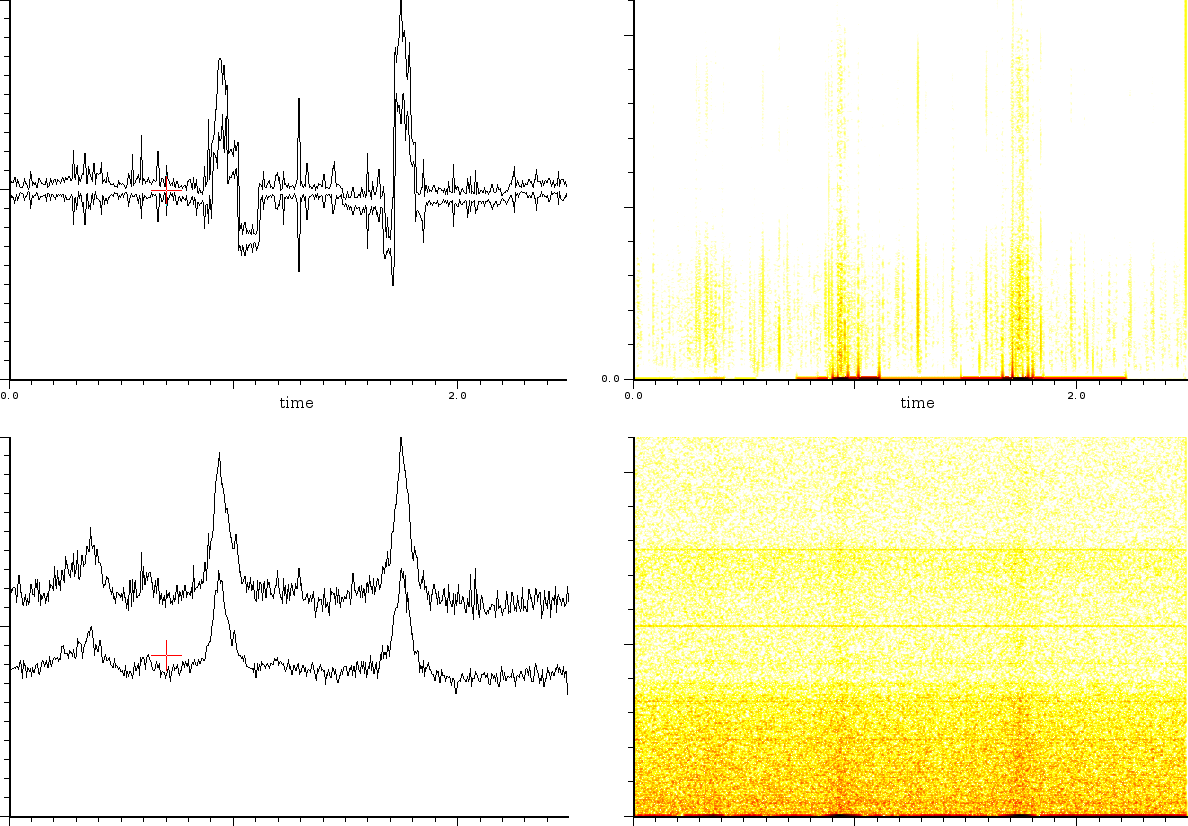
To clarify this further:
the upper part of figure
![[*]](/usr/share/latex2html/icons/crossref.png) is the noise of 1 shot. The lower
part of the same figure is after 10 shots. The upper part of figure if the noise after 100 shots and its lower part is
after
1000 shots. 1 shot gives rise to a strong pulse at a certain position.
However, as observed in the other measurements, the location of this
pulse is dependent on the actual shot. So, depending on the number
of times we shoot we get different noise fingerprints.
is the noise of 1 shot. The lower
part of the same figure is after 10 shots. The upper part of figure if the noise after 100 shots and its lower part is
after
1000 shots. 1 shot gives rise to a strong pulse at a certain position.
However, as observed in the other measurements, the location of this
pulse is dependent on the actual shot. So, depending on the number
of times we shoot we get different noise fingerprints.
Removing Artefacts
To investigate the feasibility to obtain more data out of the spectra, we created a number of denoising and enhancing techniques which we briefly present below.
Baseline Extraction
 Baseline removal
|
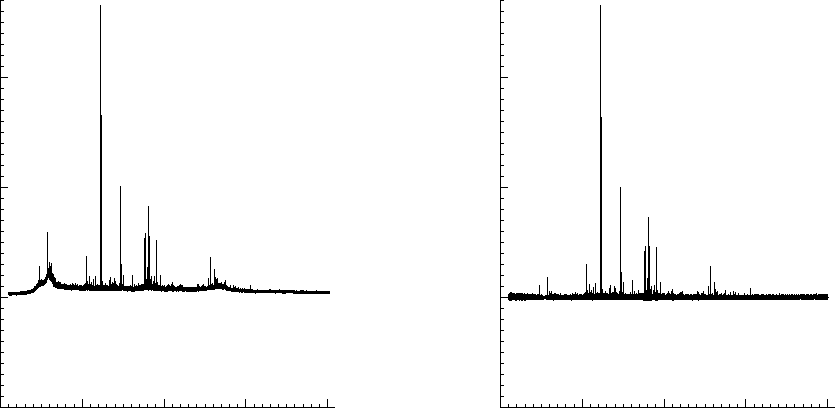
The first step is to remove the energy overhead in the measurements.
This is done by removing the baseline of the spectrum using a specific
filter technique. The result is shown in figure ![]() .
.
Mass Spectrum Denoising
 Denoised sample
|
In order to denoise the data we first tried the creation of a number
of digital notch filters. Because we don't want to shift the peaks
back or forth in time, such a filter was required to have a zero-phase
response over its entire spectrum. Also the impulse response of the
filter needed to be as small as possible because we did not want to
broaden the peaks, nor introduce unwelcome echos. A number of small
experiments indicates that the results of such a filter would not
be so very good. It became also clear that the chirp could not easily
be removed by such a time independent filter. Therefore we created
another technique of which you see the result in figure ![]() .
A local closeup of the denoised data (figure
.
A local closeup of the denoised data (figure ![]() )
shows how the peaks are located at the same places, but now allow
for fully automatic detection (certainly
if you look at the
SFFT of the data), which makes its very attractive in high throughput
proteomics.
)
shows how the peaks are located at the same places, but now allow
for fully automatic detection (certainly
if you look at the
SFFT of the data), which makes its very attractive in high throughput
proteomics.
 Up: zoomed in sample output from the machine. Bottom: the same data denoised
|
The accuracy of the algorithm we created is extremely high. It will retain position information exact. However the resolution of lower peaks will be a little bit less than the higher peaks. This however should not form a problem because these peaks are still well differentiated. As can be seen in the previous pictures, accuracies far below 0.1 dalton can be achieved for smaller peaks.
Data Enhancing in High Noise Lineair Mode
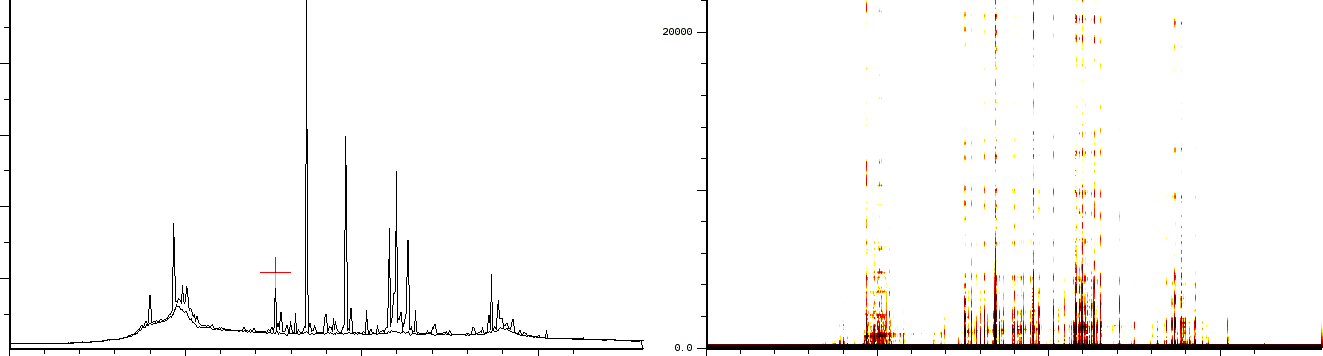
Another experiment we performed was data enhancement of a linear mode
mass spectrum. The mass spectrum we present is the output from a sample
containing the cell-lysaat of Hela-cells. Clearly it is a relatively
bad sample to put into MALDI heavy mass linear mode. Not only are
these heavy masses difficult to get suspended, but also because the
noise level might suffocate what we actually want to measure. Figure
![]() shows how data enhancing helps in filtering out
the noise.
shows how data enhancing helps in filtering out
the noise.
The result of the algorithm on a standard protein mixture is shown
in figure ![]() . Important here is that certain peaks
which would normally not be selected if we simply look at the highest
value now show up. Whether some of these new peaks are important might
be interesting to investigate.
. Important here is that certain peaks
which would normally not be selected if we simply look at the highest
value now show up. Whether some of these new peaks are important might
be interesting to investigate.
| ||||
| Upper figure is the SFFT of a measurement of a Hela cell substrate. The figure below is the SFFT of the same substrate after data enhancing (but without removal of the pulse-train). |
 Lineair mode data enhancing of the output of a ProtMix II. Bottom is the actual output. Top is the enhanced
output.
Lineair mode data enhancing of the output of a ProtMix II. Bottom is the actual output. Top is the enhanced
output.
|
Automatic Detection of important peaks
 Correlation Measure to further select peaks
|
 Technique to detect important peaks in enhanced lineair mode signal
|
A phenomenon often used to detect important peaks is the fact that
isotopes will weigh different. For every ionized similar fragment
we will sometimes measure x Dalton, sometimes we might measure x+1
Dalton (if there is one neutron more), and so on. This knowledge can
be used to automatically detect important peaks as shown in figure
![]() . The visualized graph is the autocorrelation graph
which
mainly measures whether a peak has 'echos'. If it has echos, then
it probably is a series of peaks of the same fragment.
. The visualized graph is the autocorrelation graph
which
mainly measures whether a peak has 'echos'. If it has echos, then
it probably is a series of peaks of the same fragment.
In a similar way, if we measure the autocorrelation of the enhanced linear mode experiment, then we clearly see vertical bands. Very likely the content of every band will allow us to detect which bands are important. However, this is merely an educated guess.
Summary
We have presented a number of artifacts we have encountered in MALDI TOF and MALDI TOF/TOF machines. These are
- Static tones
- Up-sweeping tones
- Decaying tones
- Probabilistic pulse trains
- Denoising of the static tones and up-sweeping tones, without shifting the peaks back or forth.
- Enhancing of heavy mass linear mode spectra.
- Automatic importance assessment when looking at multiple peaks.
| http://werner.yellowcouch.org/ werner@yellowcouch.org |  |