 |
| O n l i n e P u b l i c a t i o n | M e d i c a l B i o i n f
o r m a t i c s |
Proposal | http://werner.yellowcouch.org/postdocbergen/index.html |
Werner Van Belle;
19 October 2006
Contact:
werner@sigtrans.org, werner.van.belle@gmail.com
Abstract: This is a postdoctoral proposal sent to the University in Bergen. This project aims to apply signal processing techniques to analyze, normalize and build models for cancer proteomics. Through linking biomedical parameters (such as survival rate) to specific protein samples (from patients), better therapy might come into reach. The project parallelly investigates data handling procedures for mass spectrometry (MALDI TOF), 2D electrophoretic gels and gene array data. The built models will be validated as estimators in a cancer research setting.
Refering:
WVB06]
Werner Van Belle;
Analysis, Normalization & Estimation Algorithms for the
Stratification of AML/ALL Cancer Patients.
Postdoctoral Proposal
submitted to the University of Bergen. October 2006
Keywords:
patient stratification, AML/ALL PAtients, denoising, normalization
Disclaimer: This is a proposal written by the beforementioned partners. Copying part of it without giving due credit must be considered plagiarism. If you are interested in this research consider contacting one of the partners to discuss the presented research.
Recently a cooperation with Haukeland University Hospital led to experiments in relation finding on p53Ab stained immunoblots from 73 acute myeloid leukemia (AML) patients and acute lymphoblastic leukemia (ALL) patients. These experiments revealed various correlations (ranging from -0.304 to 0.458 using the stringent Spearman rank order coefficient) between the patient survival rate and the patient immunoblot (taken before treatment).
|
AML is a rapidly developing malignancy of the non-lymphoid bone marrow, characterized by a block in differentiation and proliferation of immature cells, which suppresses normal bone marrow function [LDB99]. Prognosis of the AML patient is determined based on cytogenetic aberrations [GWO+98], morphological disease free bone marrow after first chemotherapy [WAG99] and mutational status for the receptor tyrosine kinase Flt3 [KGF01]. However, about 50% of the patients have no reliable marker for prognosis, in where gene expression analysis may add prognostic information about these patients [VVB+04,BDB+04]. The current hypothesis of leukemogenesis in AML involves one mutational hit in a signal transduction system and one hit in a transcription factor [GCF04], and gene expression analysis may reflect hits in thus far unknown signaling networks. We have recently suggested that signaling through phosphoprotein networks elucidate the underlying response mechanisms for chemotherapy, and may mirror the risk stratification in AML [IHK+04]. A question that rose was whether it was possible to decode this information at a complex junction in cancer cell fate determination after chemotherapy; at the post-translational modifications level of the p53 protein.
|
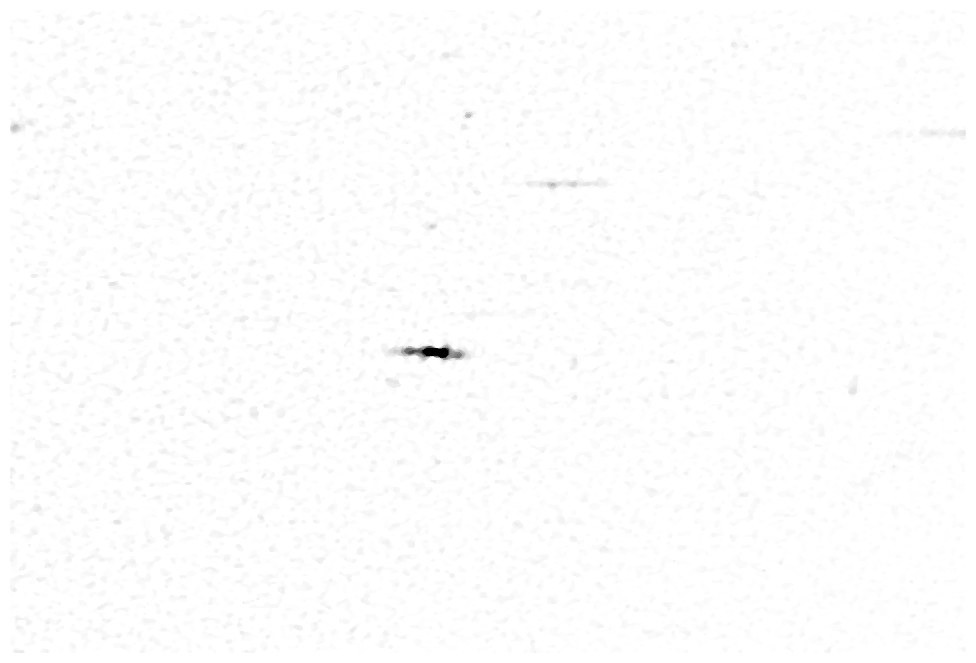
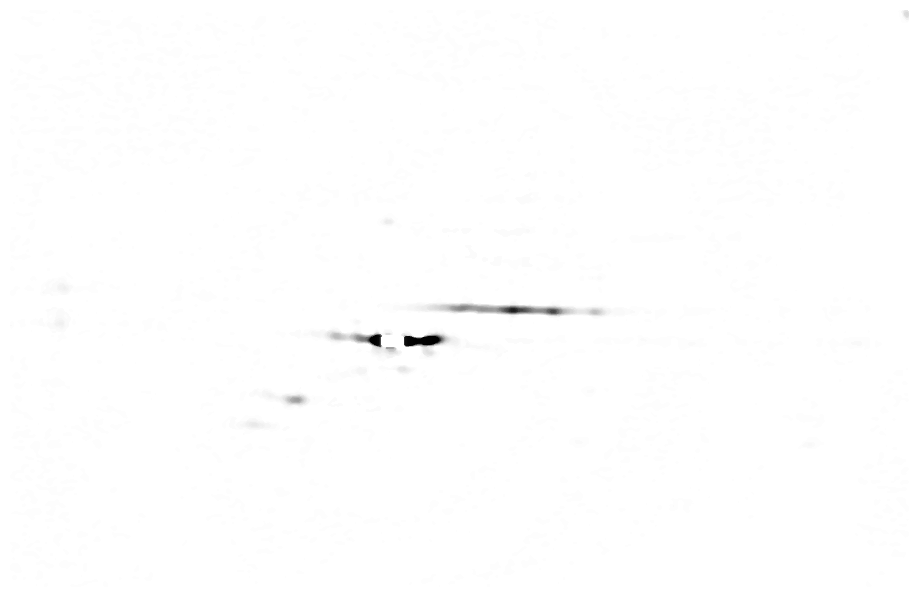
We visualized p53 protein isoform distribution in purified AML cells for patients using two-dimensional gel electrophoresis with immunoblot analysis (2DI) of p53. This method determined the unique p53 pattern of 39 AML cases and 8 ALL cases. After alignment and normalization of 2DIs we performed a correlation analysis with the clinical parameters overall survival, response after first course of chemotherapy [WAG99] and finally the Flt3 mutational status [KGF01]. We observed significant consistencies in p53 pattern for these parameters. The method used to measure the correlation and their significance is given in figure 1.
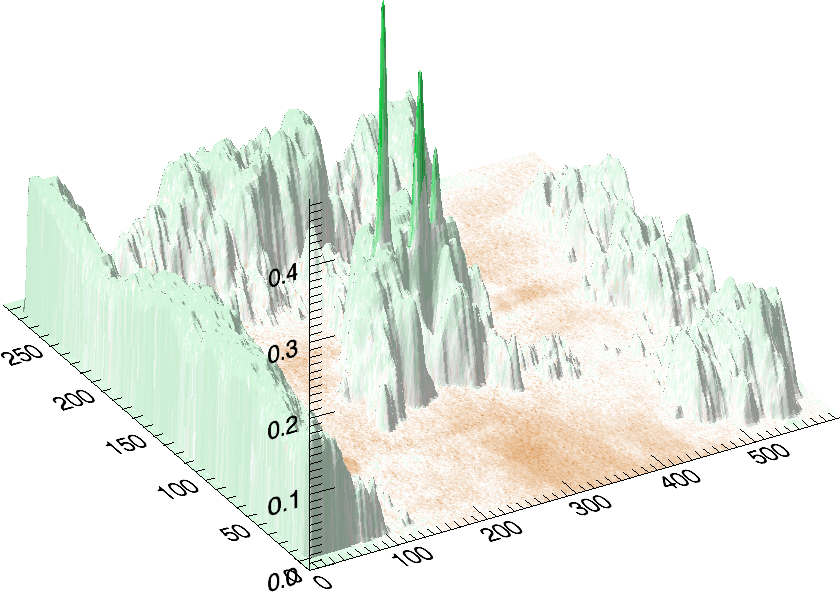
Fig. 2
shows the measured correlations. At least
16 interesting spots can be found: a) 3 correlating p53-![]() isoforms, b) 4 anti-correlating spots in the low pI p53-
isoforms, b) 4 anti-correlating spots in the low pI p53-![]() tail, c) approximately 3 anti-correlating spots in the hi-pI p53-
tail, c) approximately 3 anti-correlating spots in the hi-pI p53-![]() tail, d) 3 anti-correlating spots below the p53-
tail, d) 3 anti-correlating spots below the p53-![]() region,
e) a strong anti-correlating p35 (putative short form of p53) and
f) 4 anti-correlating spots in the hi-pI p53-
region,
e) a strong anti-correlating p35 (putative short form of p53) and
f) 4 anti-correlating spots in the hi-pI p53-![]() tail. The particular
presented 3D plots reveal correlations between immunoblots and survival
rate. We performed further experiments to relate other parameters,
such as AML FAB classification, patient remission, AML/ALL
classification
and Flt3 WT vs ITD mutations. They all revealed similarly important
results that could not be obtained using standard analysis techniques
(relying on spot detection, or with fewer 2DE gels).
tail. The particular
presented 3D plots reveal correlations between immunoblots and survival
rate. We performed further experiments to relate other parameters,
such as AML FAB classification, patient remission, AML/ALL
classification
and Flt3 WT vs ITD mutations. They all revealed similarly important
results that could not be obtained using standard analysis techniques
(relying on spot detection, or with fewer 2DE gels).
The many
correlations we find in the p53Ab stained immunoblots leads
us to believe that the presented technique can be further developed
to predict patient outcome. The challenge
we face with the
current data is that the single individual correlations, despite being
relatively strong, are still too weak to be used as a prediction tool.
E.g: one cannot simply measure one p53-![]() spot to predict survival
rate. Instead, we believe that a suitable combination of all relevant
spots will lead to a much better predictor.
spot to predict survival
rate. Instead, we believe that a suitable combination of all relevant
spots will lead to a much better predictor.
The proposed project first investigates calibration and normalization between various data acquisition techniques, including 2D electrophoretic gel imaging, MALDI-TOF mass spectrometry and micro-arrays. Afterward, classification and prediction techniques will be developed in the context of patient stratification. The following paragraphs each represent a specific task that we will conduct during the postdoctoral period. englishAll the 2D Gel images in this proposal are either produced by Nina Ånensen or by Gry Sjøholt. The mass spectra are obtained in coopeartion with Olav Mjaavatten.
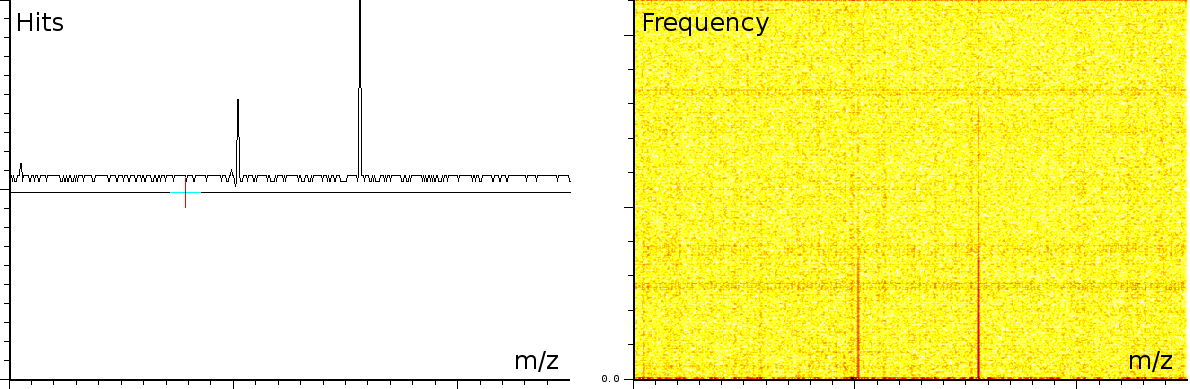
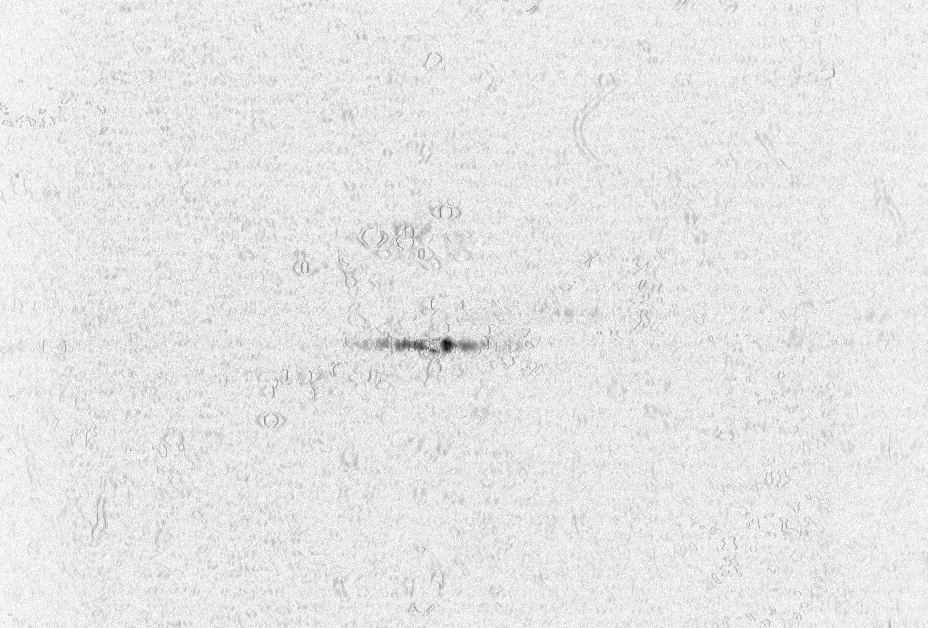
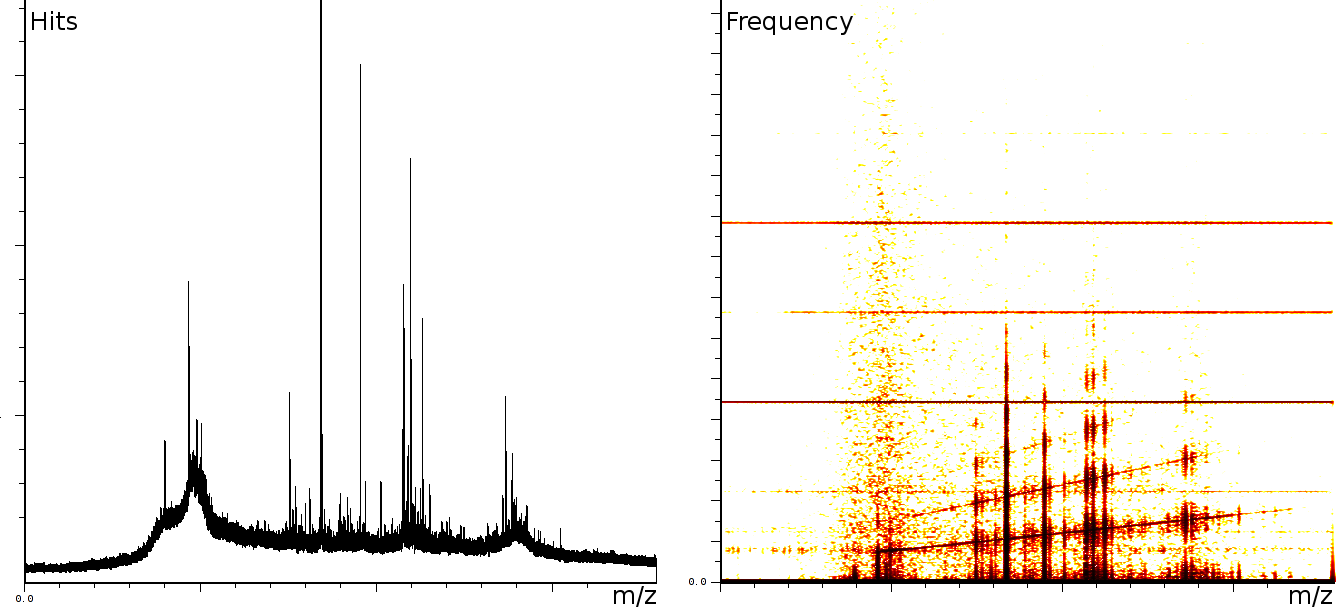
At the University of Bergen (the Proteomics Unit), we performed a number of measurements on the Ultraflex II and Autoflex machines (MALDI TOF and MALDI TOF-TOF). The output of these machines contains a number of artifacts, which are also present on machines located at other sites, such as the Flemish Biotechnology Center and freely published online spectra. The investigation of the spectral output of the machine is based on a sliding windows Fourier transform (SFFT). In our calibration tests we found a) linear tones, b) decaying tones and c) coherent noise.
|
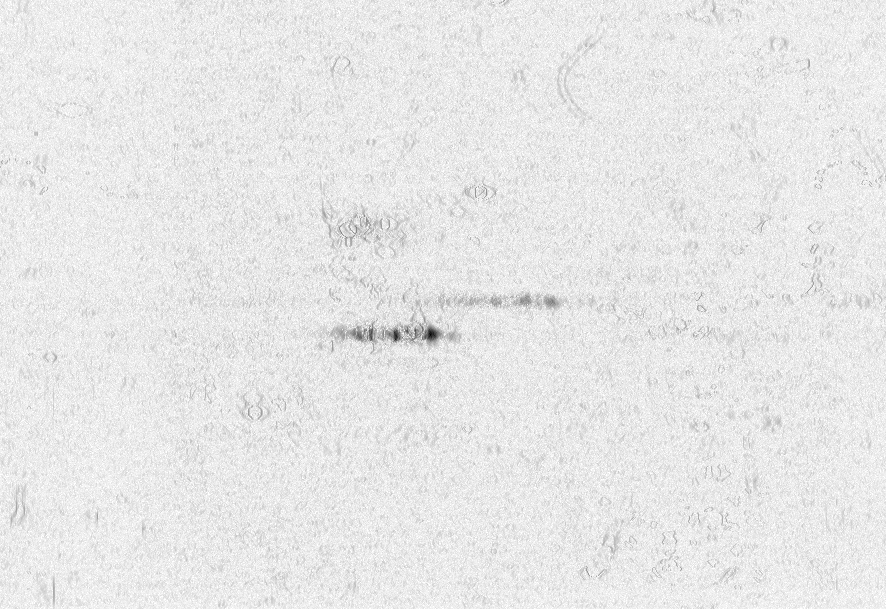
englishFigure 3a shows 3 static tones superimposed over the signal (these are the three horizontal lines), as well as 3 linear upward sweeping tones (the three slightly upward slanted lines) and a burst of noise shortly after the deflection mode of the machine.
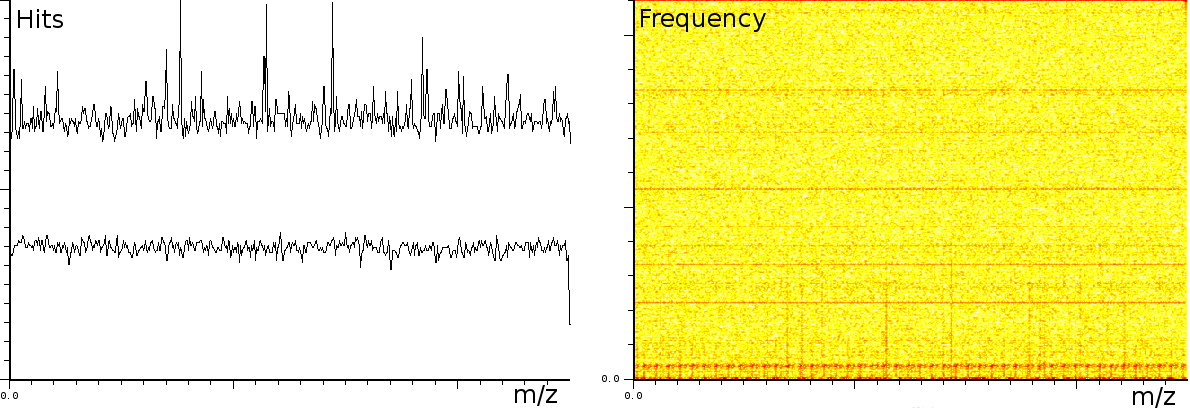
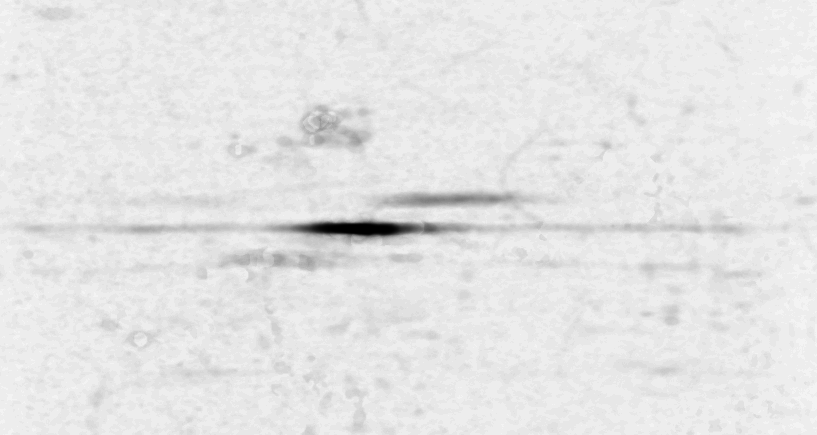
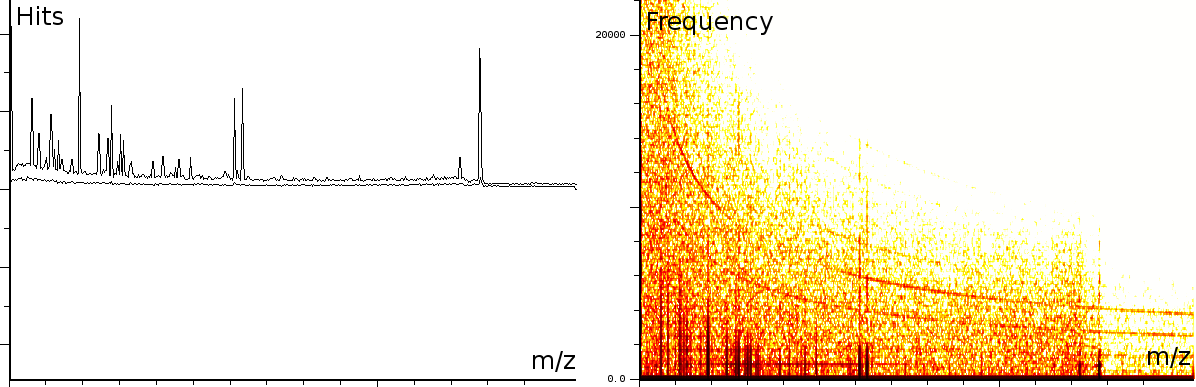
In a second experiment (figure 3b) we measured the lift of a peak using a MALDI-TOF/TOF machine. The mixture contained a protein-fragment which was to be sequenced. The frequency analysis shows static tones at a low frequency and decaying tones which start at a high frequency and decay exponentially. Also, these LIFT experiments have often a very low signal/noise level. Even so that an expert is needed to select the correct peaks for further analysis.american
|
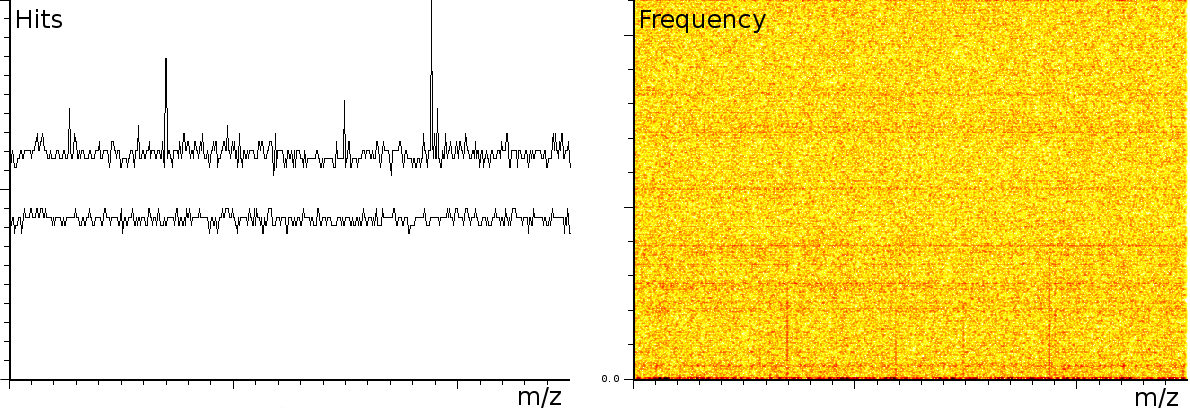
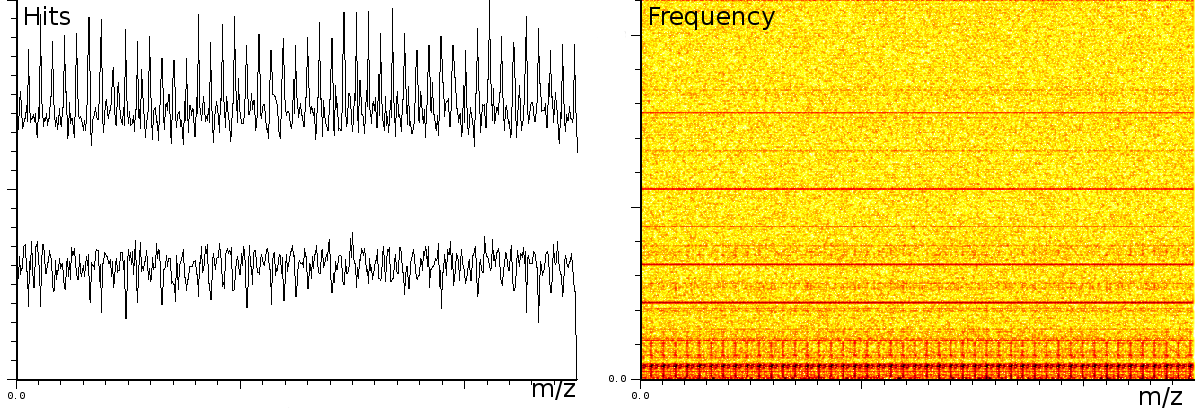
In a third experiment we measured the pure noise output of a MALDI machine in linear mode. During the experiment, the laser was switched off, as such we measured only the noise generated by the machine. In this experiment we found noise coherence. Depending on the number of shots performed, the noise fingerprint will be different, and the more shots are performed the lower the signal/noise ratio becomes. Figure 4 shows the noise fingerprint after a different number of shots (1, 10, 100 and 1000). One shot gives rise to a strong pulse at a certain position. The location of this pulse is random however there are positions which have a higher chance of producing such a phantom peak. So, depending on the number of shots performed we will see different phantom peaks. If we perform few shots the phantom peaks will be strong, if there are many shots, the noise will overrun the intended measurement. american
Many of these artifacts can be removed and our preliminary results already led to a number of algorithms to do so [BM05]. Nevertheless, more validation is necessary to publish these results. Especially, validation of known standards, comparison of the output of peak detectors on both denoised and original mass spectra. To achieve this we will cooperate closely with PROBE and the VIB (University of Ghent; Belgium).
|
|
Correlation and analysis of multiple 2DE gels relies properly aligned images. Standard alignment algorithms typically work between any two 2DE gels [WF05,AKY+03,IAH95,DI94,Cur04,CP92]. Unexpectedly, there seems to be no good straight forward extension towards multiple images. Neither of the trivial extensions, among which dynamic alignment (align one image on top of the previous image) and progressive alignment (align a new image on the projected sum of all previous images) produce good results. They tend to strengthen features found in the initial image (Fig. 5).
We experimented with an algorithm that positions all images such that the distance between every image-pair is as close as possible to the measured translation of that pair. The results are promising because all the expected isoforms could be automatically detected in the projected image. Nevertheless, the long computation time (3 days for 90 images using IDL [RSIR] on a standard PC) prompts us to investigate the possibilities optimized search algorithms [Bel06]. We plan to publish these results.
|
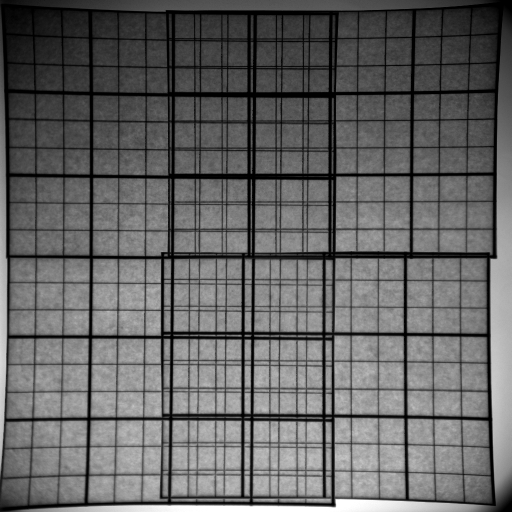
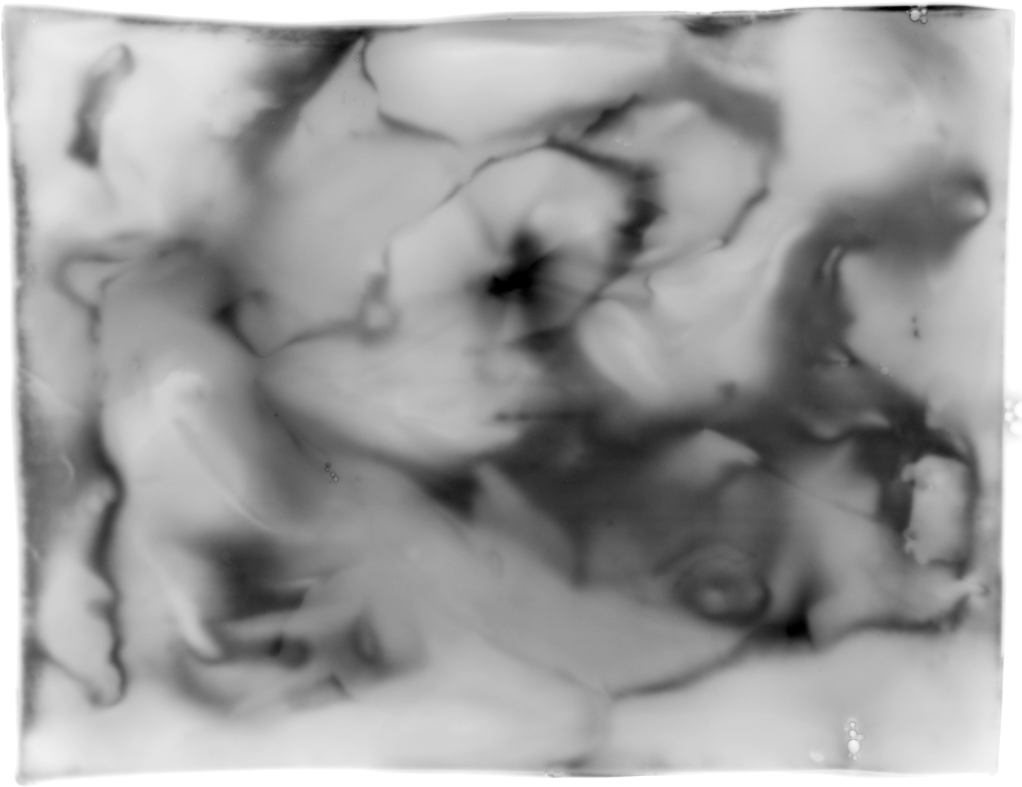
It is well know that 2D gels tend to bend in the middle area. This together with the standard handling procedures (washing and possible drying) lead to spots that shift around the surface in an inconsistent manner. Aside from the gel handling procedures, Lens effects might be responsible for spot shifts as well (both demonstrated in figure american6).
We will investigate the creation of field warps to account for all of these effects. Combined with the multi-image alignment algorithms from §2.2, this should lead to more reliable mappings between various samples. Tentatively, our metric will minimize the first differential of the displacement map; as such thin plate splines with local landmark detection will be investigated [DB03,Elo,Boo89,Duc76,Mei79,Wah90,Bel00,WAB+04,WF05].
|
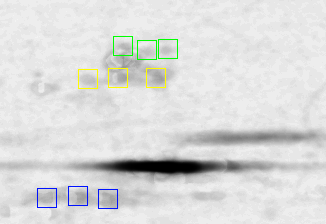
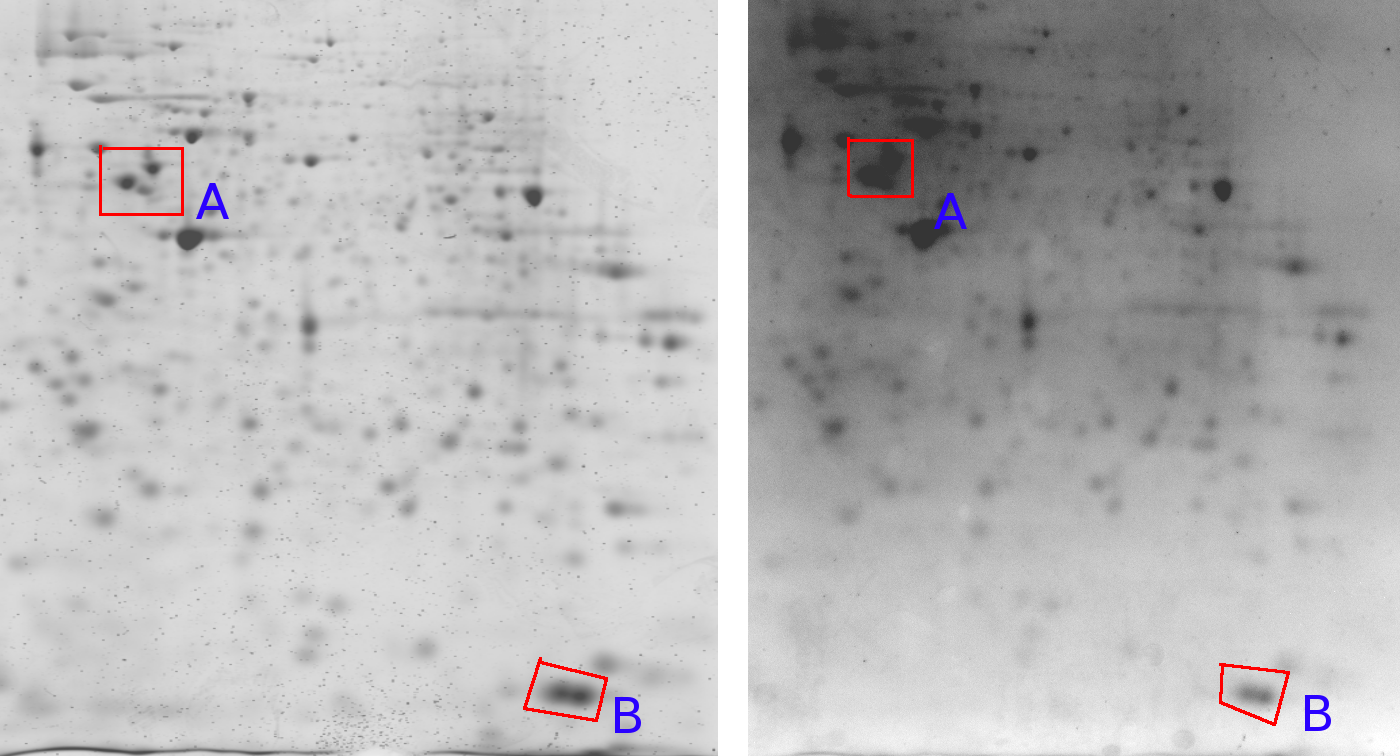
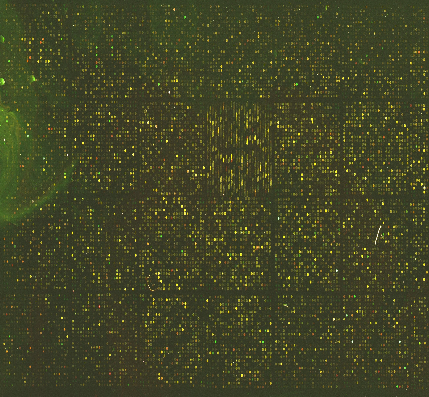
Figure 7 shows one gel captured by two different cameras. An important observation here is that the relative grey value levels are not the same on the two machines. Area A shows three clearly differentiated spots for the Typhoon imager, while this area is a blur in the Kodak imager due to a too strong signal level (Kodak A > Typhoon A). On the other hand, the Typhoon imager observes darker grey values in area B than the Kodak imager (Kodak B < Typhoon B). This is a clear contradiction of which the cause lies in the different imaging approaches used by the two cameras. This indicates that normalizations of 2D gels, which is crucial for a scientific quantitative protein analysis, remains a challenging task [LK03]. englishA similar problem might arise in gene-array data where, depending on the hardware lens effects might occur as well (Figure 7).
We will establish standard procedures for data normalization based on specific machine measurements (base line acquisition). This will lead to data data can be compared between different machines. In turn this leads to better quantifiable experiments and it will also be necessary for further correlation tests (§2.5) and gel-array correlations (§2.7).
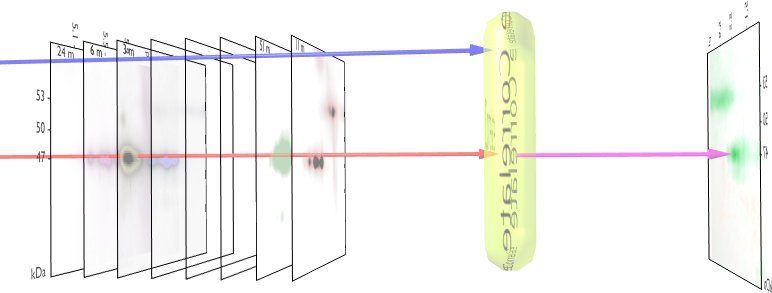
In 2005, we developed a technique to measure correlations between 2D gels and biomedical variables [ÅIHDBG06,BAH+06]. This technique can be further refined taking into account baselines and new alignment algorithms as described in §2.2, §2.3 and §2.4. The analysis technique will also be extended with novel significance measures based on canonical correlations, copula testes and linearity tests. Further spectral analysis will be introduced to measure oscillatory phenomena in multiple 2D images. These initial improvements will be integrated into the GelSignal software (http://www.sigtrans.org/) and might lead to a new publication based on the software technology.
After that, more thorough improvements will become possible. A useful technique to analyze behavior in 2DE gels are intra-gel correlations. This technique compares a specific position towards every other position in the gel and reports how similar their behavior is, irrelevant of the external biomedical variable. Such analysis will helps biomedical sciences to find and identify spots with the same behavior. Extending this further makes it possible to link every position in the gel towards the same external feature vector. This will be important for §2.7 and §2.8.
Dimensionality
reduction is an important tool in both visualization
and actual analysis of results. We will rely on singular value
decomposition:
PCA (Principal component analysis) and PCR (principal component
regression)
[C.M95] is commonly used to
reduce the dimensionality of
multidimensional data. Specific to our research is the possibility
to consider every gel as a point in an ![]() dimensional space
with
dimensional space
with ![]() and
and ![]() the respective horizontal and vertical size of
the images. Reducing this large dimensional space (
the respective horizontal and vertical size of
the images. Reducing this large dimensional space (![]() dimensions
at a common size of
dimensions
at a common size of ![]() ) to a number of principal axis
should allow us to pseudo-color gels by assigning colors to the
principal
axis. Other techniques such as image segmentation [SC95,CS96]
will be investigated as well. Both make it possible to compress the
gel content for further analysis in a predictive context (§2.8).
The same techniques are applicable to micro array data as well (§2.7).
) to a number of principal axis
should allow us to pseudo-color gels by assigning colors to the
principal
axis. Other techniques such as image segmentation [SC95,CS96]
will be investigated as well. Both make it possible to compress the
gel content for further analysis in a predictive context (§2.8).
The same techniques are applicable to micro array data as well (§2.7).
An important possibility offered by the correlation tests we developed is its extension to link gene-array data to 2D gels. Such 4 dimensional maps (one correlation picture for every micro-array dot) can be best visualized by first reducing the dimensionality of the associated micro-array information. (E.g: dots that behave the same can be classified in their own cluster and lead to a feature vector to which the gel images are correlated.
We will test the current available micro data [ØBJ+06,ØBJ05] towards the various patients by means of the before mentioned dimensionality reduction techniques and the new correlation capabilities as developed in §2.5.
Automatic classification can both be used as an exploratory tool and a prediction tool. Unsupervised learning techniques will help detecting natural classes while supervised methods will weigh different attributes based on their relation to the associated biomedical parameter.
Unsupervised classification will be provided as a form of exploratory and data understanding tool. The kind of classification we will provide is Bayesian classification as implemented in Autoclass [SC95,CS96]. If this turns out too slow, we will rely on the data reduction techniques developed earlier (PCA/PCR analysis). Our expertise in this area will be augmented with multivariate clustering algorithms developed by the applied economics research lab in Leuven, Belgium [CJ05,CRG05,SCFE0x]. Pseudo-coloring will be conducted along the following lines. Every class will be associated with a color. The influence of every attribute (pixel) onto that specific class determines the presence of the specific color. Supervised classification will be explored together with the bioinformatics platform in Bergen.
Partial least
squares (PLS) is a linear regression technique that
has been successfully applied to chemometrics problems. Typically,
chemometric problems have small training data sets, but high
dimensionality,
for instance a small number of ![]() -point
spectra, with corresponding
known constituent concentration data. The number of different
constituents
-point
spectra, with corresponding
known constituent concentration data. The number of different
constituents
![]() contributing to each
spectrum is necessarily much smaller than
contributing to each
spectrum is necessarily much smaller than
![]() .
.
PLS is closely related to PCR, but take advantage of response information in the construction of component vectors. Low rank projections of both the data matrix and the response matrix are calculated, and the component vectors are found by minimizing a quadratic cost function depending on both the low rank data matrix and the low rank response matrix. This is the main difference between PCR and PLS. In the special case of one-dimensional response data (which is already low rank), the least squares regression corresponds to maximizing the covariance between the remaining lowrank data and the response data vector sequentially until sufficient covariance is accounted for.
The main advantage of PLS over PCR is obviously that the component vectors are directly related to the response data of interest, rather than ordered only after how much of the variability in the data set is accounted for. This means that the component vectors are much more likely to be physically meaningful. In chemometric applications, the component vectors are usually more similar to the known constituent spectra than the principal components of PCR. In some cases, application of the PLS method has even resulted in significant spectral residues, attributed to contaminants, that were not present in the original calibration mixtures. Thus, the PLS method potentially has high predictive potential. american
The advantages and applicability of the presented research are manifold. Denoising and normalization of inter-instrument data will lead to