| Home | Papers | Reports | Projects | Code Fragments | Dissertations | Presentations | Posters | Proposals | Lectures given | Course notes |
|
|
Sampling the Transfer Function: Frequency Response, Phase Response and Group DelayWerner Van Belle1,1 - werner@yellowcouch.org, werner.van.belle@gmail.com Abstract : Explains how to sample the transferfunction of a discrete linear time invariant filter. How an enveloped tone can be used to sample the groupdelay, frequency response and phase response of any linear time invariant system. This is useful to double check analytical solutions of filters as well as calcualte frequency responses for finite impulse response filters.
Keywords:
phase dealy, phase response, group delay, latency, frequency response, transfer function |
Table Of Contents
Introduction
When dealing with digital filters it is often useful to understand the filter in greater detail. That means knowing the frequency response, phase delay and group delays. In short, the transfer function.
Given a frequency annotated with z and its presence in an input signal X, then the output of the filter, for that frequency, can be written as Y.
The transfer function is hereby the modification the input signal undergoes and is written as
Because z represents a complex oscillation, the transfer function
defines both the gain (which is  , or
, or
 when decibels are required), and
the phase modification, which is
when decibels are required), and
the phase modification, which is  . For many
IIR filters (biquads, butterworths, chebyshevs, bessel filters, ...)
analytic solutions exist.
. For many
IIR filters (biquads, butterworths, chebyshevs, bessel filters, ...)
analytic solutions exist.
For arbitrary FIR filters, given by the coefficients c_0...c_n, it suffices to calculate the Fourier transform of the coefficients. Each bin will then provide the phase response and the frequency response of the respective frequency. The problem is that the information 'between' the bins is lost and cannot be easily interpolated. So, we would, for instance, know the responses at 20 Hz, 40 Hz, 60 Hz, but nothing in between, which is often too inadequate.
Sampling the transfer function with a steady tone
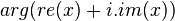
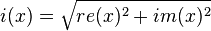
To solve this, the filter can be tested by inserting a wave of specific frequency and then measuring that what comes out of it. The easiest method to do this is to instantiate two filters of the same type and put into the first a sine and in the other a cosine. This pair represents the real and imaginary parts of a complex oscillation. We will call the two inputs re(x) and im(x). Given these two, the amplitude of the wave is given as
and the phase as
Frequency Response
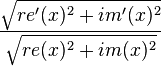
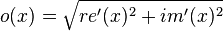
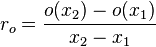
We will call the signals that come out of the filter re'(x) and im'(x). Also this pair allows us to calculate the amplitude and phase. Together with the amplitude of the input signal, we can calculate the gain of the transfer function. All we need to do is divide the output gain by the input gain:
Of course, one must give the filter some time to adapt and detect the frequencies. Therefore it should be primed with e.g 4096 samples before measuring the frequency response.
Phase Response
The phase response can also be measured. It is given by the change in phase between the input and output:

The advantage of sampling the transfer function with such a pair of waves is that we can measure 'between the bins' and that it works for any linear time invariant filter, without needing analytic solutions (not that they are bad, but it helps to have a secondary system to test whether they are correct).
Group Delay
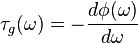
The problem now lies in calculating the group delay. The group delay is defined as a differential of the unwrapped phase:
which is a problem to calculate because we don't have a 'differential' that we can sample. The easiest solution would be to sample two consecutive phase responses, subtract them and divide by the angular difference. This approach leads to unsatisfactory results because off rounding errors, and the resulting groupdelay oscilates strongly in the high frequency range. There is luckily another method to find the group delay.
Sampling the transfer function with an enveloped tone
Another definition of the group delay is how much the envelope is delayed. This is something we can measure by putting into the system a wave with increasing envelope and then measuring when that envelope comes out of the system again.
Below we explain how both the group delay and frequency response can be obtained from such an envelope increasing pulse.
Input
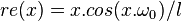
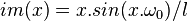
in which l is the length of the block we will put into the system.
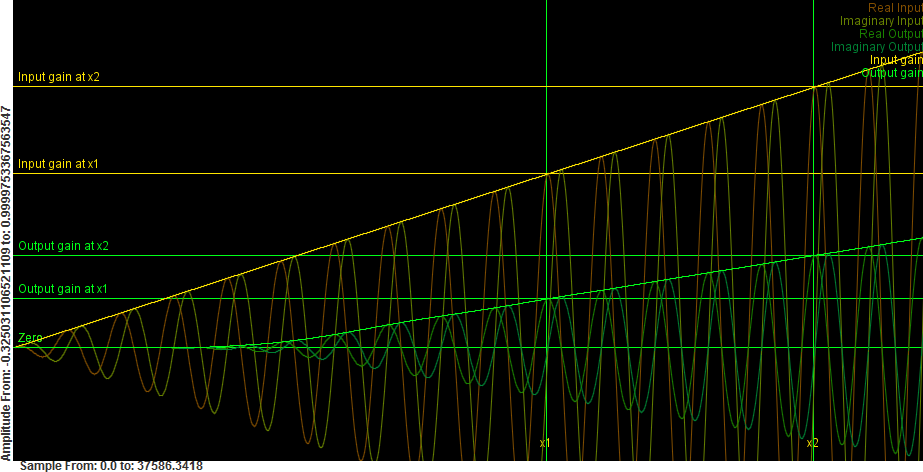 Sampling the
transfer function with an enveloped tone. The yellow signals are the
real, imaginary and amplitudes of the inputs. The greenish signals are
the real, imaginary and amplitudes of the output.
Sampling the
transfer function with an enveloped tone. The yellow signals are the
real, imaginary and amplitudes of the inputs. The greenish signals are
the real, imaginary and amplitudes of the output.
|
The filtered signal is denoted re'(x) and re'(y). As explained before, the input and output amplitudes are:
The figure illustrates these 6 functions (real input, real output, imaginary input, imaginary output, input amplitude and output amplitude). The phase delay can still be measured as before. However, the frequency response can no longer be simply obtained as a division of o(x)/i(x). That is because the output amplitude will come out of the system delayed, and we would effectively be dividing an output amplitude from the past with an amplitude 'now'. However, we also don't know the group delay (yet).
Luckily, groupdelay and frequency response are two distinct features off the envelope, and we can use this one sampling to obtain both at the same time.
Group Delay
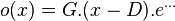
Given a sine wave

If this is send through a filter with group delay D and gain G, we would obtain the following output
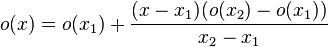
The group delay of the filter can thus be found at the position where the output amplitude crosses the zero line. o(D)=0. This is something we can deduce by measuring two arbitrary points on the output amplitude. (e.g: x1=l-1, x2=l/2 or l-2). The gain function o is then written as
This line is 0 at
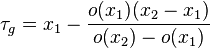
which is the group delay in samples.
Frequency Response
The correct gain of the filter is then obtained by dividing the output at time x and the input at time x-D
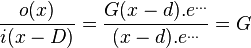
which might be somewhat of a problem because the group delay might not be an integer. Another strategy is to interpolate between two points, which, if extended, leads to a division of the two direction coefficients of both lines.
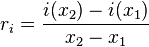
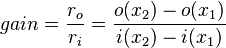
The ratio of the output slope over the input slope is the gain
Phase Response
The phase response can be measured in exactly the same manner as before.


When the gain of the filter is 0, calculating the group delay or phase responses is difficult. Nevertheless, in those instances, they don't matter because the gain is 0 anyway. At very low gains, round off errors might occur.
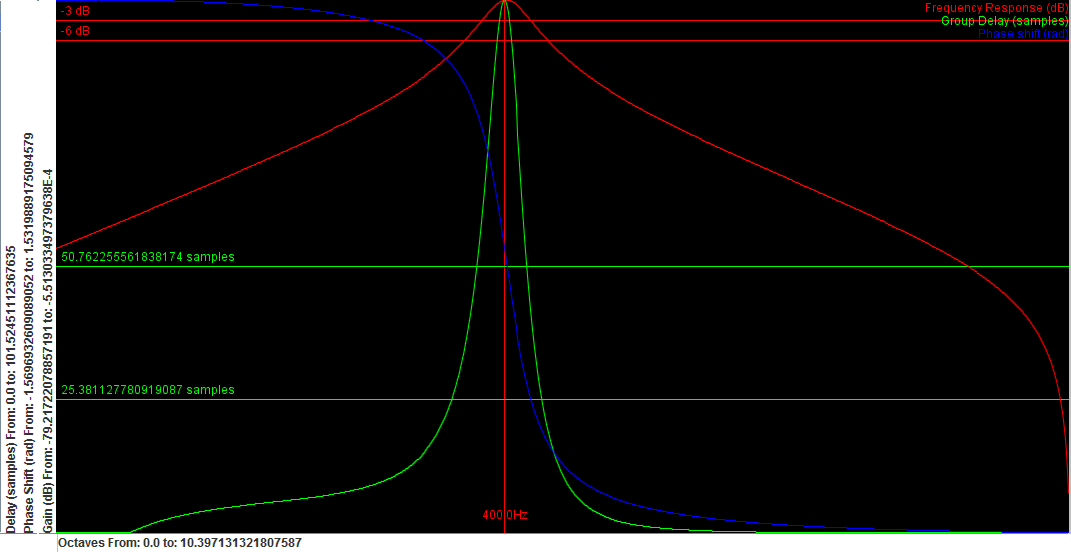 Frequency response of a simple biquad
filter.
Frequency response of a simple biquad
filter.
|
| http://werner.yellowcouch.org/ werner@yellowcouch.org |  |