| Home | Papers | Reports | Projects | Code Fragments | Dissertations | Presentations | Posters | Proposals | Lectures given | Course notes |
|
|
The S-Plane and Z-PlaneWerner Van Belle1 - werner@yellowcouch.org, werner.van.belle@gmail.com Abstract : Illustrates the differences between the S-plane and the Z-plane.
Keywords:
s-plane, z-plane |
Table Of Contents
| The S-plane The Z-plane | Audio in both planes Bassdrum Sine wave at 10Hz |
The S-plane
The S-plane is a mathematical construction that maps each position in the complex plane to an exponentially decaying/increasing sine-wave, as given by the formula

To understand the details, observe the following.
- e to the power on an imaginary number represents a sine/cosine pair.
- adding a real part to the exponent implies an exponential decaying or increasing amplitude.
- The last equation show how these two pieces of information are directly combined into one equation e^(-st)
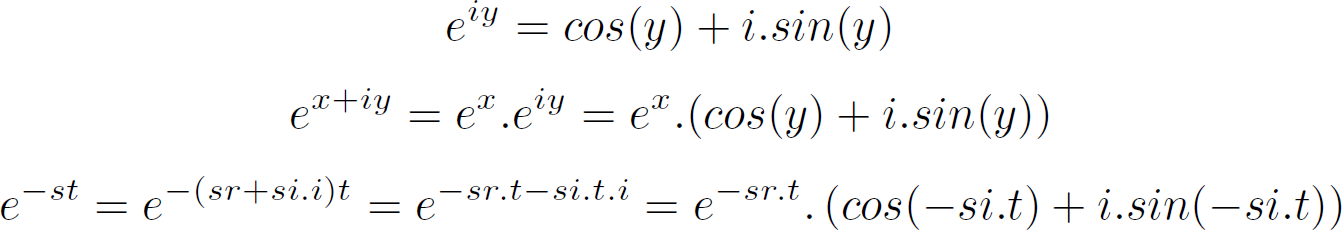
In the above equations sr=real(s) and si=imag(s).
Below we took a number of random points in the S-plane and drew the sine/cosine's they represent.
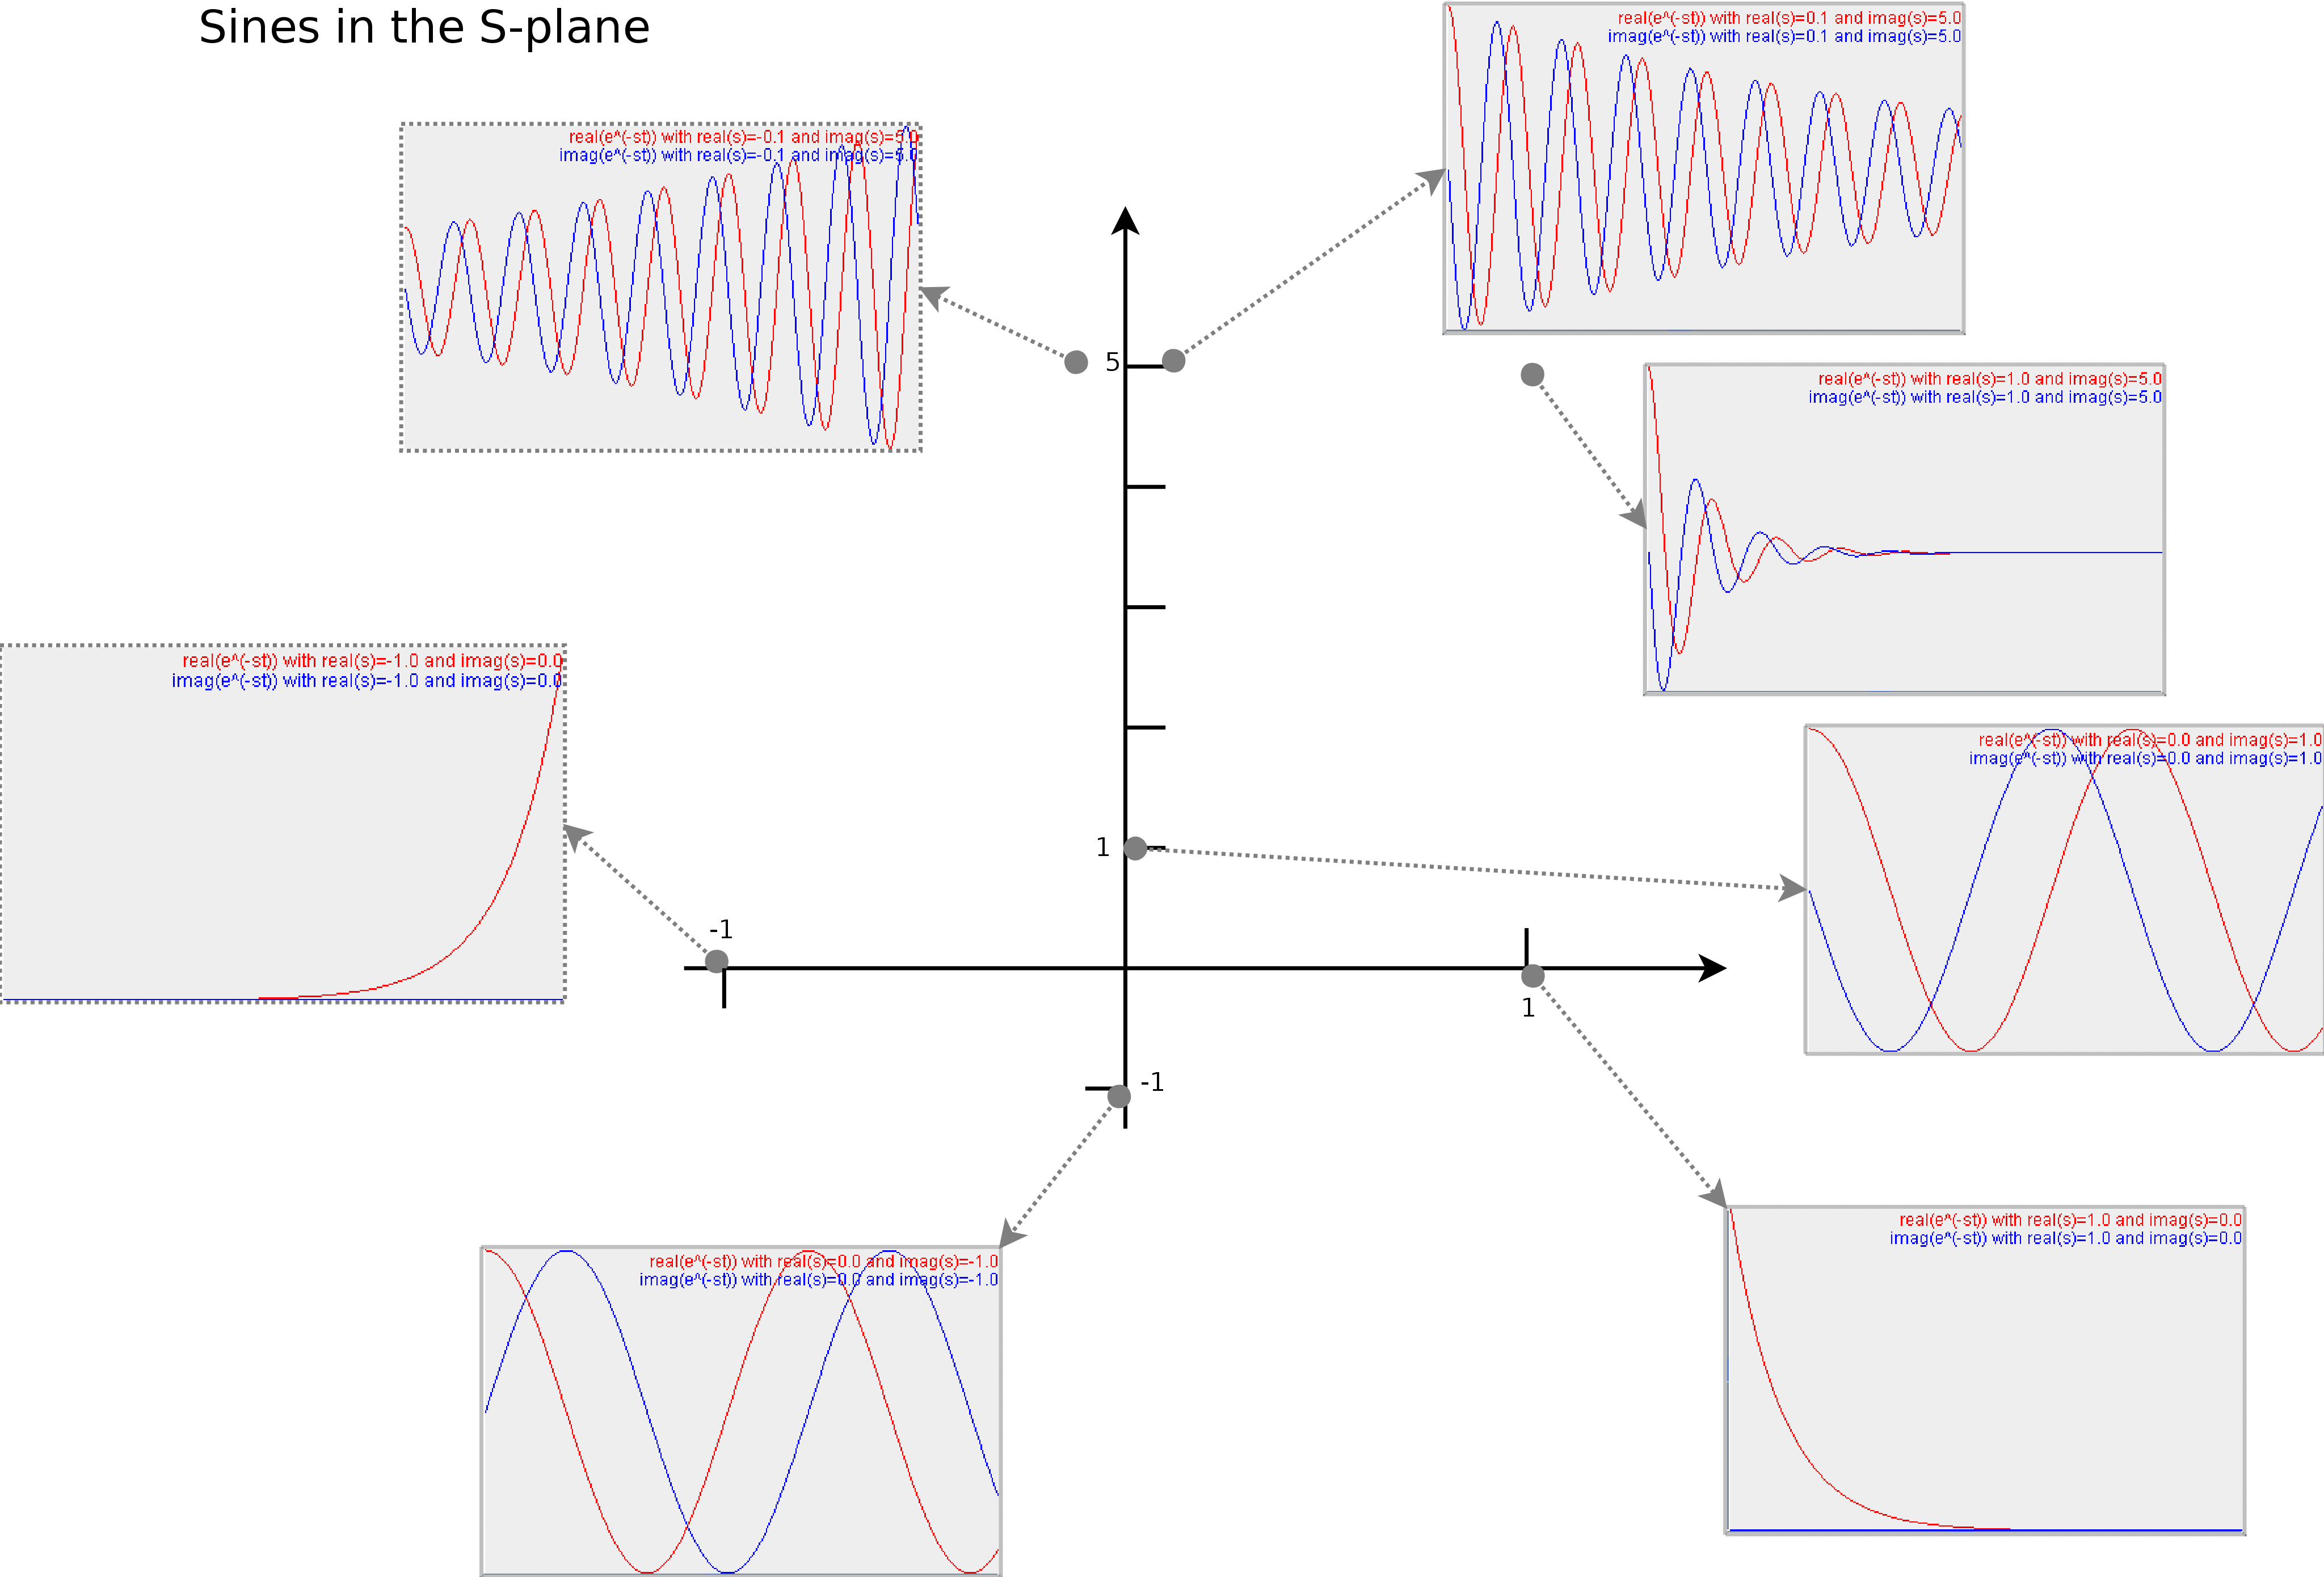 Illustrates the type of sine/cosine waves at various positions in the S-plane. Each (x,y) coordinate represents the real and imaginary part of s. In other words, the imaginary axis is set out vertically. The real axis, horizontally. The red lines are the cosine (the real part of e^-st). The blue lines are the imaginary part of e^-st. In each subplot, t ranges from 0 to 10
|
The horizontal axis: If we now observe this plane carefully, we find that the right half of the S-plane represents decaying waves, while the left part of the plane represents waves that increase in amplitude. Only on the imaginary axes, do we find waves that remain stable.
The vertical axis: If we move along the imaginary axis we find that we start with no oscillation at y=imag(s)=0, and increase the frequency as we move away from the X-axis. Thus the imaginary axis represent the frequency content.
From my point of view, the S-plane is an artifact from the past, useful to design analog filters. In electric circuits it is after all necessary to describe discharge/charging times of capacitors. These timings can be found on the left/right side of the S-plane. Nevertheless, in non-analog, non-continuous systems (the ones I'm interested in), the representation is often superseded by the Z-plane.
The Z-plane
The Z-plane is another beast. Instead of assigning to each position an exponentially decaying/growing sine, we assign to each position an exponential decaying/growing sine. Except that we position them differently across the space we have.
Instead of taking the complex exponent of e, we take a real exponent of a complex number 'z'. Thus, by definition, each position in the z plane corresponds to the function

Similar to the S-plane, we would like to understand what type of wave is represented by z^t.
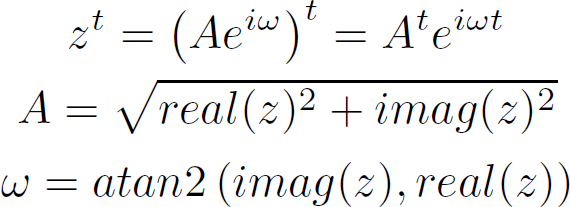
In the above equations we first rewrote z as a complex exponent and a mode. A is the distance of z to the origin. omega is the angle of z to the horizontal axis. Both can easily be raised to a power. The resulting value has a mode, which is the mode of z raised to the power of t, and an angle which is the multiplication of the angle of z and t.
We now again look at a number of points in the z-plane, and the waveform they represent
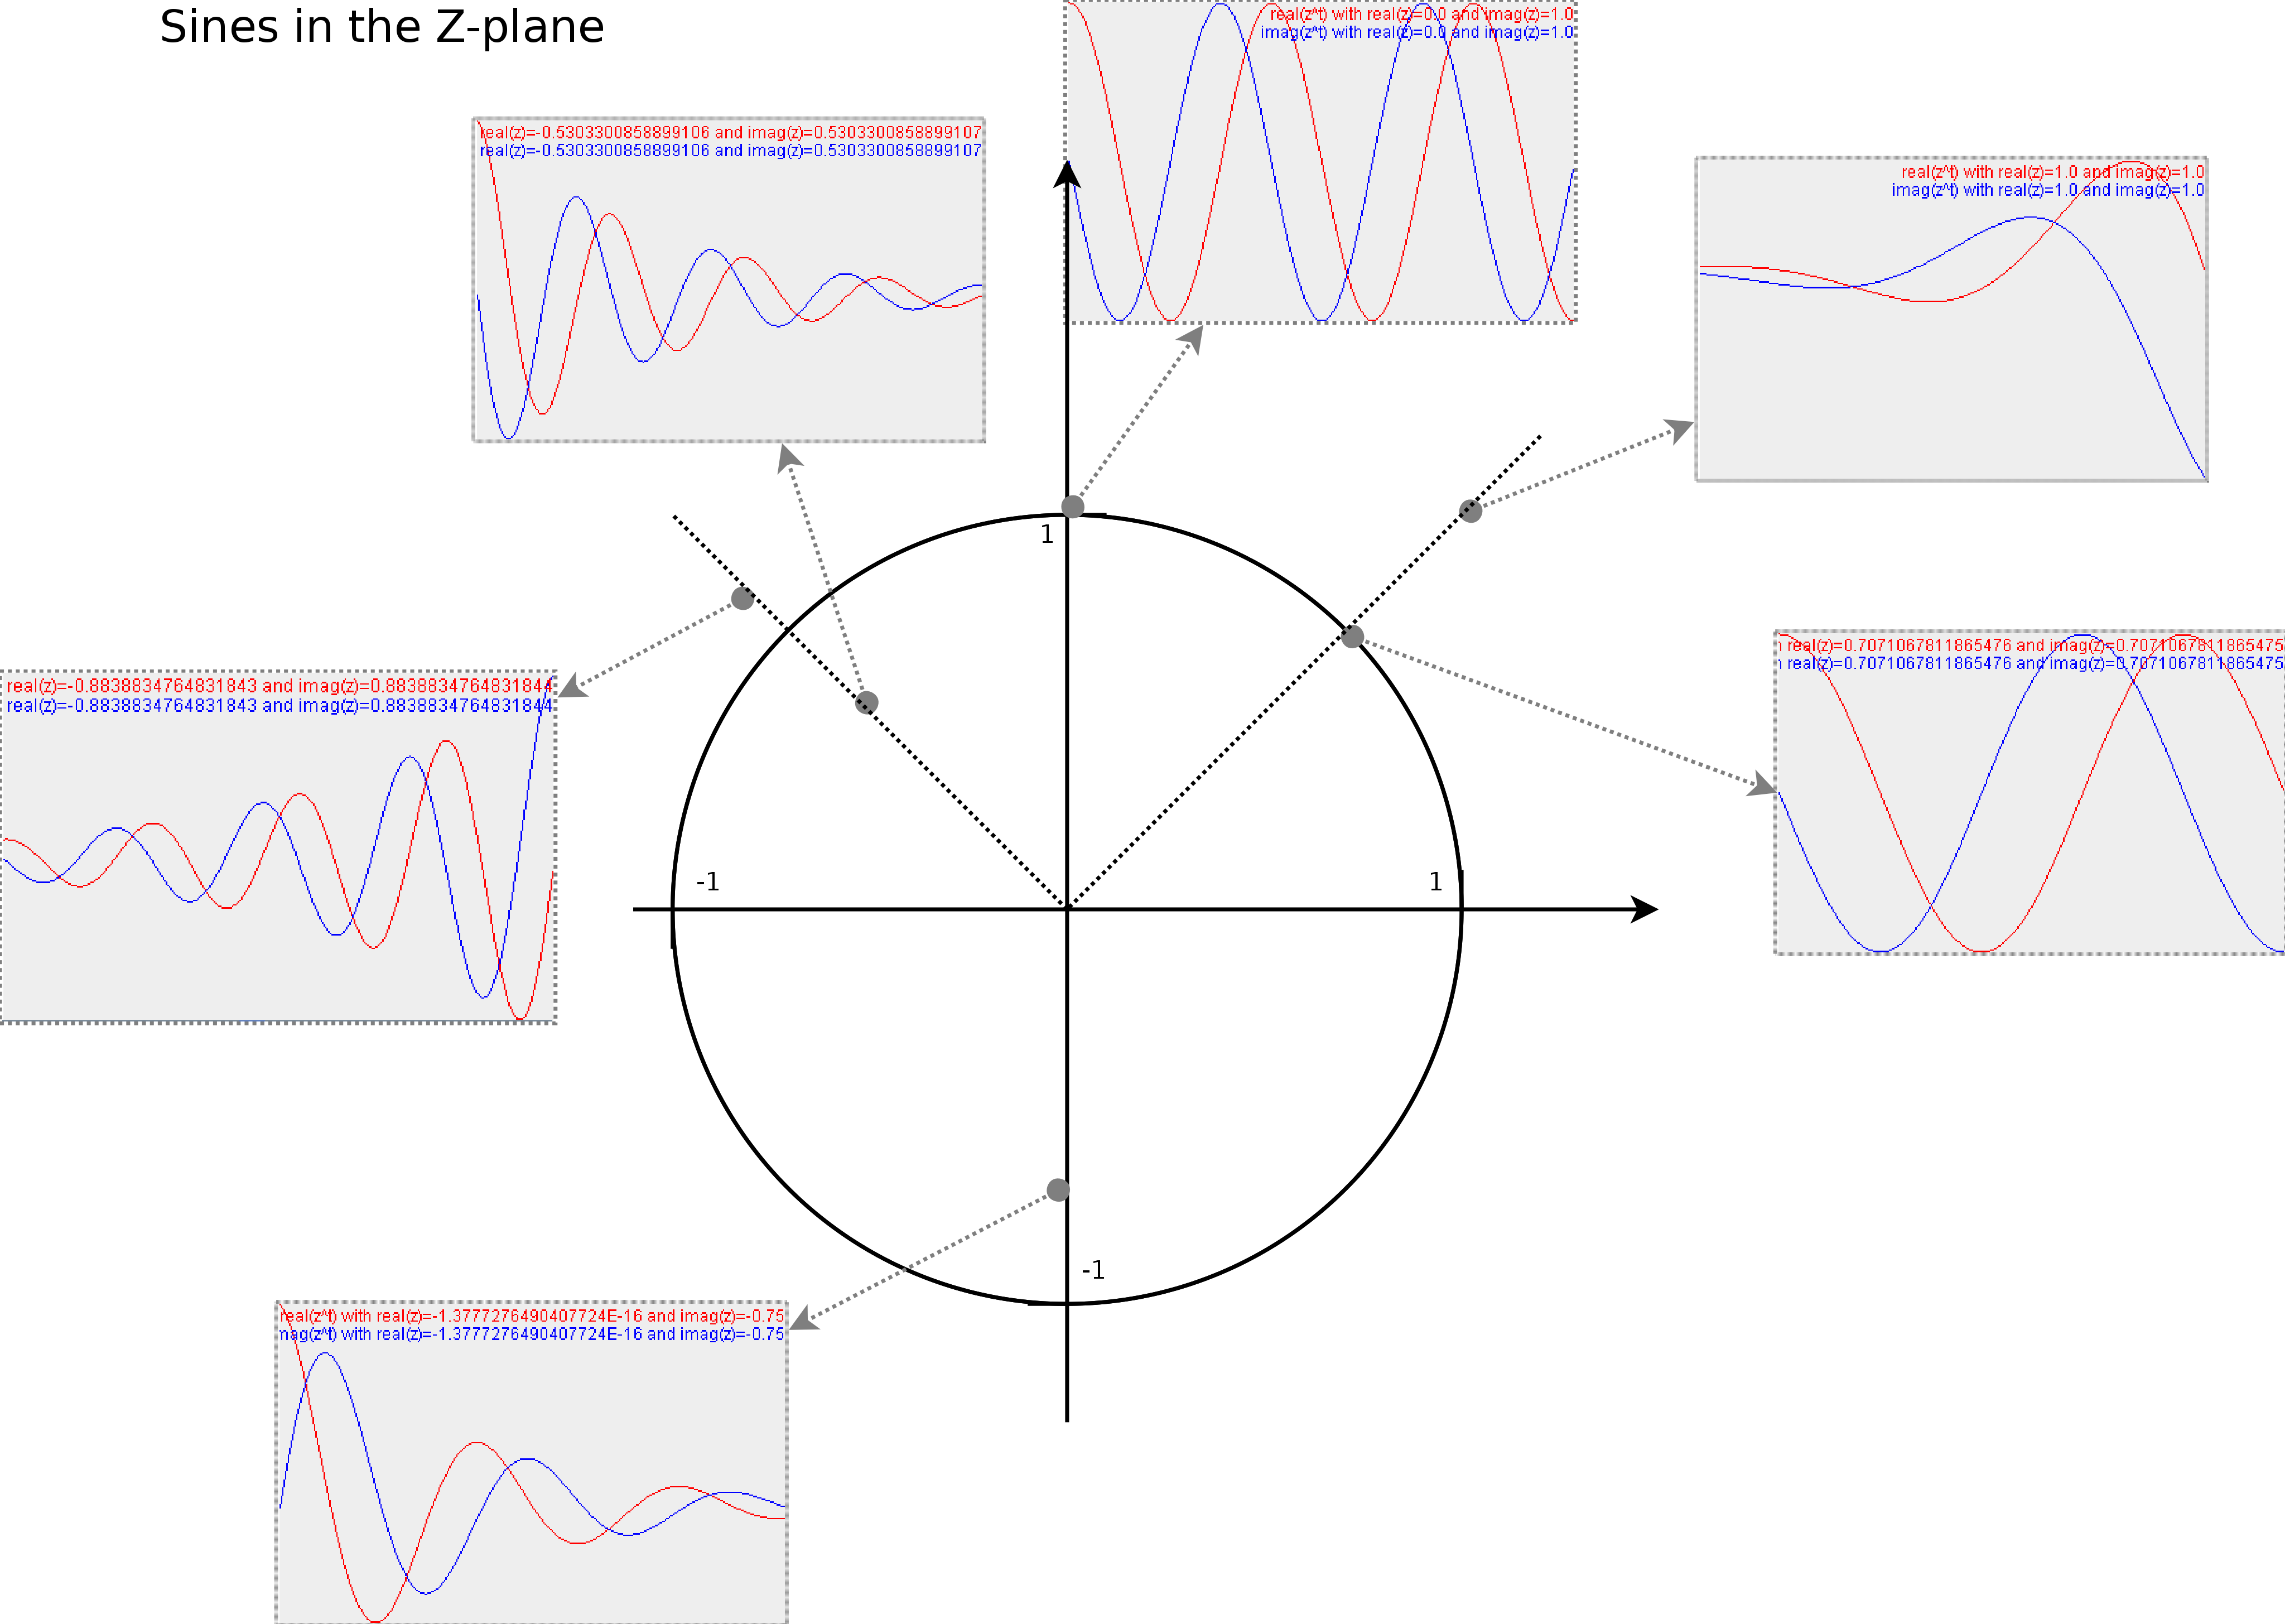 Illustrates the type of sine waves at various positions in the z-plane
|
Audio in both planes
Bassdrum
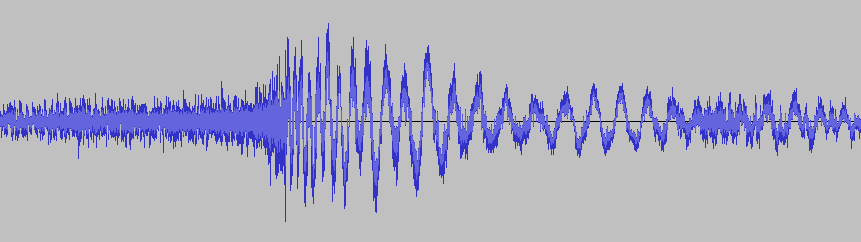 The audio signal we will represent in S and Z
|
Out of curiosity I calculated the integral of each sine/cosine pair towards the audio fragment above, in accordance with the following equations
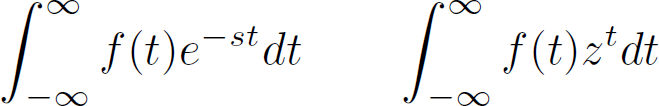
For each tested wave (e^-st or z^t), the integral will report how well that wave 'resonates' with the audio under investigation (represented by f(t)). The result is a complex value, of which the mode specifies how strongly that wave matched the audio. The angle of the result tells us how far the audio and the wave are out of alignment (the phase).
| ||||
| Shows the magnitude of the audio, when integrated into the S/Z-plane. Red/bright is maximum magnitude (61.4 db). Blue/Black is minimal magnitude (-30.53 dB). |
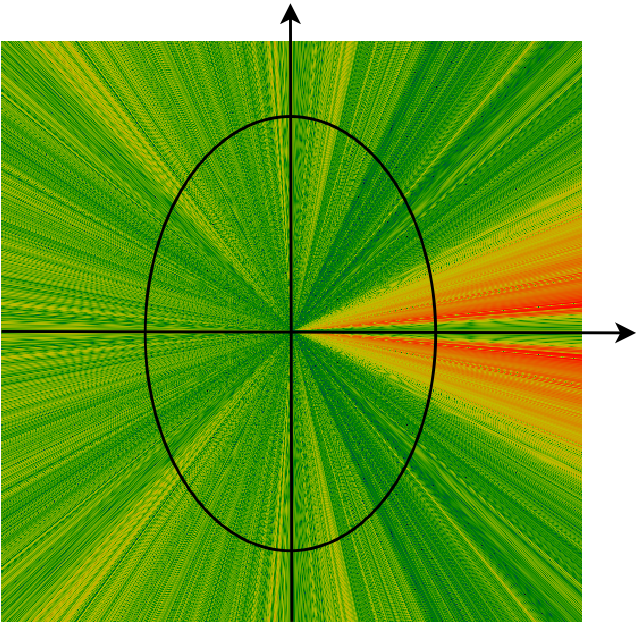
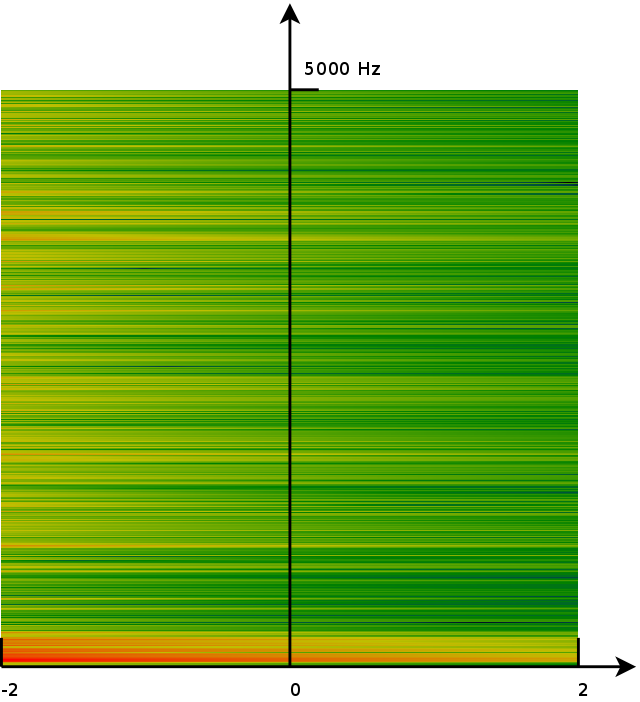
In the above images we see that the y axis of the S-plane corresponds to half a turn on the unit circle ion the Z-plane. (The other half of the unit circle in the Z-plane maps to the negative frequencies on the y-axis of the S-plane). In general, the main areas of interest for sound analysis are the upper half of the y-axis in the S-plane, or the upper half of the unit circle in the Z-plane. Those are the fourier transforms of the audio and provide us with the frequency content of the audio fragment.
Sine wave at 10Hz
In the illustrations below we plotted the S and Z-plane representations of a sine wave of 10Hz, sampled at 100 Hz, for about 10 oscillations.
| ||||
| Shows the magnitude of the audio, when integrated into the S/Z-plane. Red/bright is maximum magnitude. Blue/Black is minimal magnitude. |
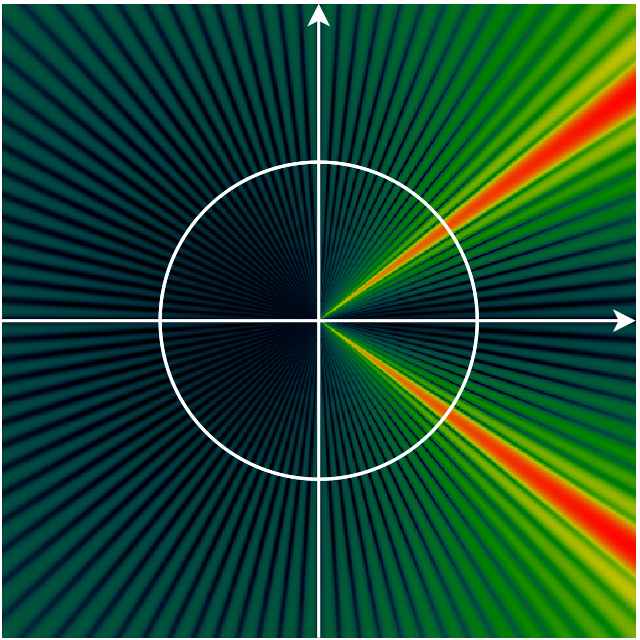
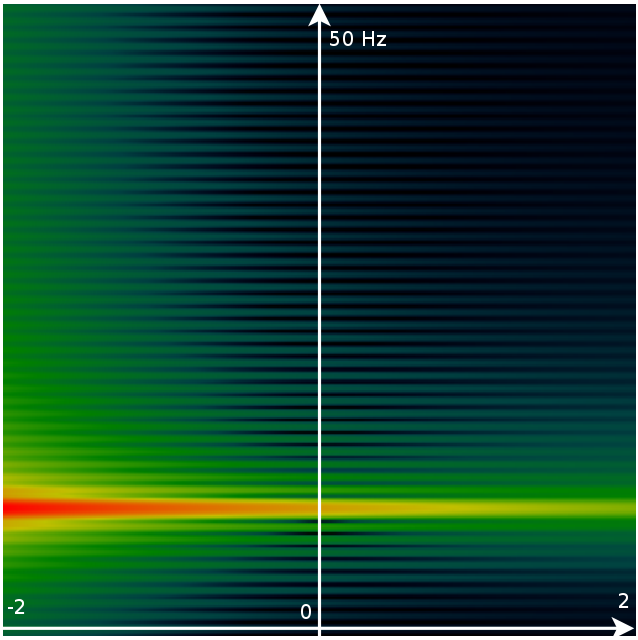
In the image above we see a number of interesting properties.
- the fact that we only have 10 oscillations of the wave and then multiply it with a potentially incomplete sine wave. E.g: if the integral tests the sound wave of 10Hz against a wave of 9 Hz, then the 9Hz wave will be truncated. That leaves a residue which is visible as the radial pattern in the Z-plane.
- The 10Hz wave can be found at pi/5, but also at -pi/5. This results from the fact that the negative frequencies have wave that travel backward, but are otherwise pretty much the same as ordinary sine waves, at the same frequency.
- Both planes are highly redundant. A single wave affects multiple frequencies (a ray starting at the origin in the Z-plane), a horizontal line in the S-plane. This is normal, and also the reason people are only interested in the unit-circle/upper part of the y-axis.
| http://werner.yellowcouch.org/ werner@yellowcouch.org |  |