| Home | Papers | Reports | Projects | Code Fragments | Dissertations | Presentations | Posters | Proposals | Lectures given | Course notes |
Denoising of MALDI-TOF, 2D Gels and NMR SpectraWerner Van Belle1* - werner@yellowcouch.org, werner.van.belle@gmail.com Abstract : In this project we aim to use signal processing techniques to remove noise and normalize data of three different spectroscopy techniques: MALDI-TOF mass spectrometry, 2D gel images and NMR spectroscopy. Removal of noise is important in order to obtain more accurate data, to allow for automatic analysis in high throughput proteomics and to understand experimental limitations. Normalization schemes are necessary to compare results between different machines and different samples. This research will lead to a better quantitative understanding of experimental inaccuracies and allow for quantified biological comparisons. The developed algorithms will be freely accessible through a web interface
Keywords:
Denoising, MALDI TOF, 2D Gels, NMR Spectra |
In cooperation with Bjørn Tore Gjertsen - Hematology Section, Department Internal Medicine, University Bergen; Kari Fladmark - Proteomics Unit at the University of Bergen; Maria J. Macias - Structural and Computational Biology, NMR Department, Science Park Barcelona; Ingvar Eidhammer - Bioinformatics Group, Department Informatics, University of Bergen; Ugo Moens - Department of Microbiology and Virology, University of Tromsø ; Niels Aarsæther - Department of Biomedicine, University of Bergen; Marijke Van Ghelue - Department Medical Genetics, University Hospital North-Norway
1 Introduction
In this project we aim to use advanced signal processing techniques to remove noise and normalize data of three different spectroscopy techniques: MALDI-TOF mass spectrometry, 2D gel images and NMR spectroscopy. Removal of noise is important in order to obtain more accurate data, to allow for automatic analysis in high throughput proteomics and to understand experimental limitations. Normalization schemes are necessary to compare results between different machines and different samples. This research will lead to a better quantitative understanding of experimental inaccuracies and allow for quantified biological comparisons. The developed algorithms will be freely accessible through a web interface.
The project is set up as a multi-track research program in which we parallelly investigate Mass Spectrometry, 2D gels and NMR. Below, we first introduce each technique and describe the artefacts we encountered. After presentation of the three techniques we present the project structure and the advantages offered by denoising. The project will be hosted at Norut IT which is part of the applied institute sector in Norway. As such, we will address the practical problems of the different techniques and transfer our existing competence in earth observation and signal processing. This will be done through communication, acquisition of data, development of algorithms and publication in cooperation with the different partners.
2 Mass Spectrometry
In MALDI-TOF (Matrix assisted laser desorption ionization) a sample
is mixed with a matrix. When this mixture dries it forms crystals.
When such a crystallized mixture is targeted with a high energy laser
beam with the correct wavelength, the matrix itself will suddenly
absorb the incoming energy and heat up. This rapid heating causes
sublimation of the matrix and subsequent expansion of the molecules
co-crystallized within the matrix. The ions are then accelerated using
a strong electrical field and thus separated based on their ![]() ratio (mass/charge). The ions can be detected at the end of the tube,
or reflected and then be detected. In a typical proteomics setup a
mass spectrogram is taken, the peaks are selected and used to
fingerprint
proteins.
ratio (mass/charge). The ions can be detected at the end of the tube,
or reflected and then be detected. In a typical proteomics setup a
mass spectrogram is taken, the peaks are selected and used to
fingerprint
proteins.
Artefacts
At the University of Bergen (the Proteomics Unit), we performed a
number of measurements on the Ultraflex II and Autoflex machines.
The output of these machines contains a number of artefacts, which
are also present on machines located at other sites, such as the
Flemish
Biotechnology Center and freely published online spectra. The
investigation
of the spectral output of the machine is based on a sliding windows
Fourier transform (SFFT). This transform shows the frequency content
of the signal at a specific ![]() position. When a data series
is converted to the frequency domain we can see which frequency is
present at which time and with how much strength. E.g; the right side
of picture 1a and 1b
has 2 axis. The X-axis is the
position. When a data series
is converted to the frequency domain we can see which frequency is
present at which time and with how much strength. E.g; the right side
of picture 1a and 1b
has 2 axis. The X-axis is the ![]() axis. The Y-axis represents
the frequency scale. On the top we find high frequencies, on the bottom
we find low frequencies. Every
axis. The Y-axis represents
the frequency scale. On the top we find high frequencies, on the bottom
we find low frequencies. Every ![]() position in this diagram has
a color. White means that frequency
position in this diagram has
a color. White means that frequency ![]() is not present at position
is not present at position
![]() (or
(or ![]() ). Yellow means that some signal is
present
and red to dark red indicates a very strong presence of the given
frequency. A particle hitting a detector should give rise to a vertical
line in the frequency diagram.
). Yellow means that some signal is
present
and red to dark red indicates a very strong presence of the given
frequency. A particle hitting a detector should give rise to a vertical
line in the frequency diagram.
Linear and decaying Tones
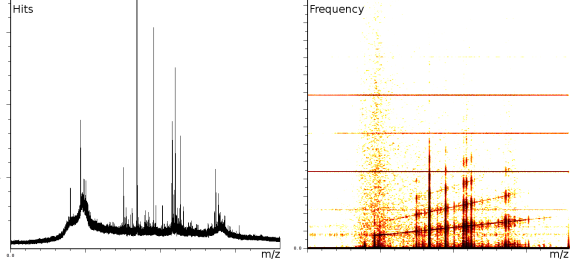  |
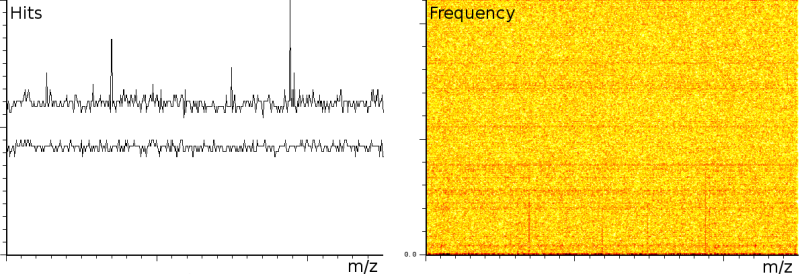
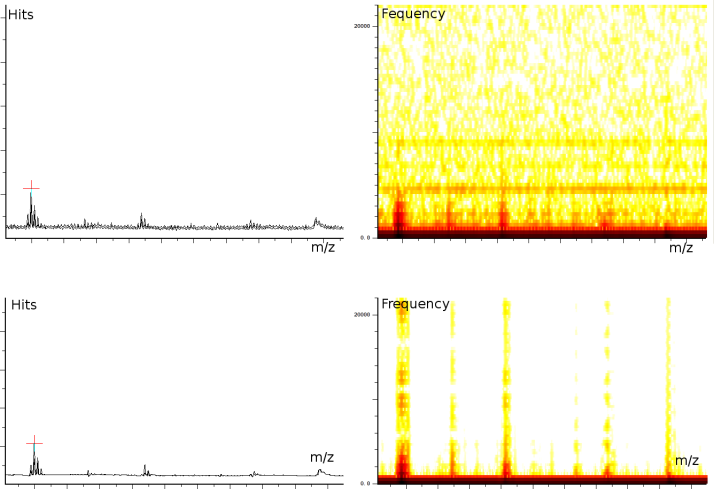
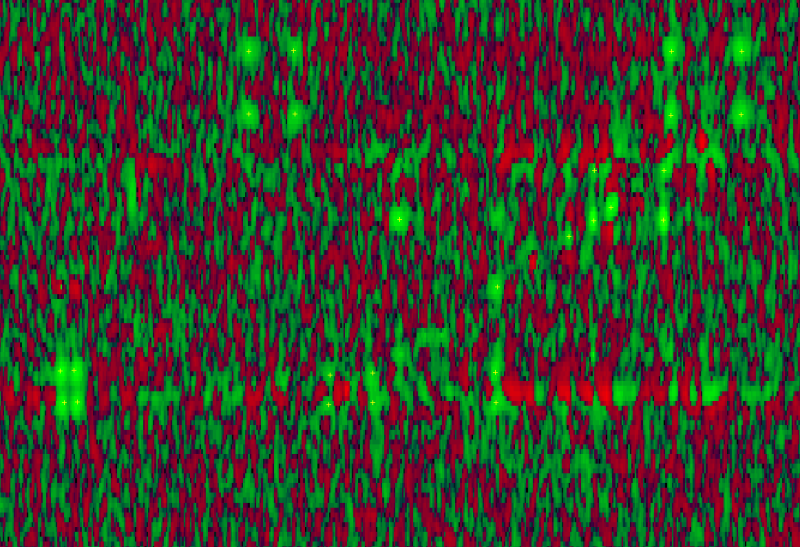
The first experiment concerned fingerprinting of a protein. In this experiment the reflection mode was turned on. The mass spectrum output consist of 158548 samples between 100.003 and 4019.170 Da. The window size of the SFFT is 2048 samples, which forms a good compromise between frequency-accuracy and position accuracy. In all the presented figures, both the m/z axis and the energy axis have been normalized. The frequency analysis has also been normalized and is shown on a logarithmic scale.
Figure 1a clearly shows 3 static tones superimposed over the signal (these are the three horizontal lines), as well as 3 linear upward sweeping tones (the three slightly upward slanted lines) and a burst of noise shortly after the deflection mode of the machine.
The tones are very likely not created by ions hitting the detector because this would mean that the ions are released at a steady frequency, independent of their size. Since the laser desorption results in a sublimation burst, such a steady periodic phenomenon is highly unexpected. On the other hand, the noise burst after the deflection phase is what one would expect, nevertheless it still makes finding peaks more difficult.
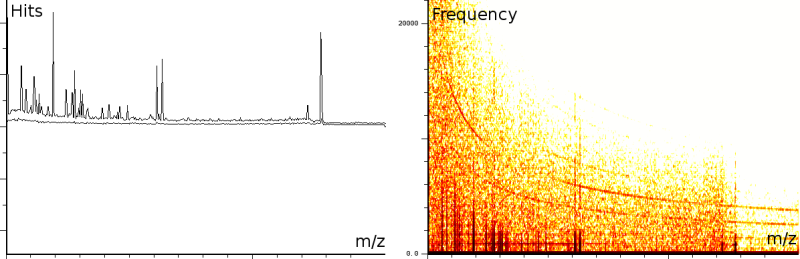
In a second experiment (figure 1b) we measured the lift of a peak using a MALDI-TOF/TOF machine. The mixture contained a protein-fragment which was to be sequenced. The output from the machine ranges from 20.067 to 1264.626, in 67873 samples. Again, the m/z, energy and frequency content are all three normalized. The frequency analysis shows static tones at a low frequency and decaying tones which start at a high frequency and decay exponentially. Also, these LIFT experiments have often a very low signal/noise level. Even so that an expert is needed to select the correct peaks for further analysis.
Coherent Noise
|
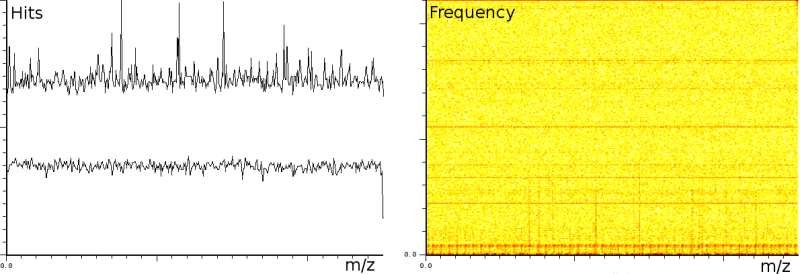
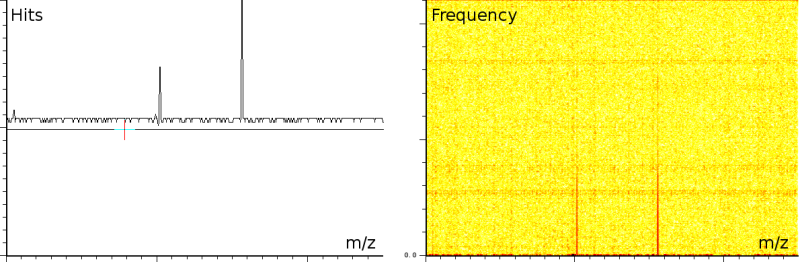
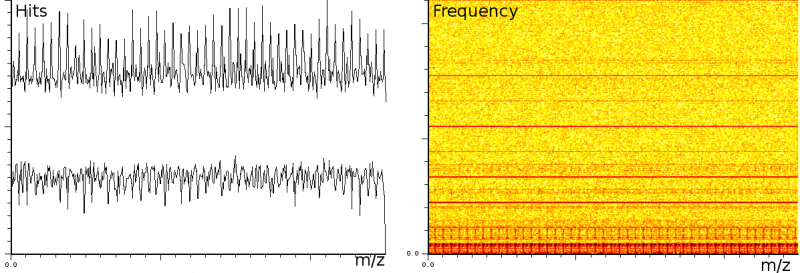
In a third experiment we measured the pure noise output of a MALDI machine in linear mode. The outputs shown in figure 2 covers 110296 samples between 40 kDa and 80 kDa. During the experiment, the laser was switched off, as such we measured only the noise generated by the machine. In this experiment we found noise coherence. Depending on the number of shots performed, the noise fingerprint will be different, and the more shots are performed the lower the signal/noise ratio becomes. Figure 2 shows the noise fingerprint after a different number of shots (1, 10, 100 and 1000). One shot gives rise to a strong pulse at a certain position. The location of this pulse is random however there are positions which have a higher chance of producing such a phantom peak. So, depending on the number of shots performed we will see different phantom peaks. If we perform few shots the phantom peaks will be strong, if there are many shots, the noise will overrun the intended measurement.
Preliminary experiments
Mass Spectrum Denoising
|
To investigate the feasibility of obtaining more data from the spectra, we already created a number of denoising and enhancing techniques which we briefly present below [BM05].
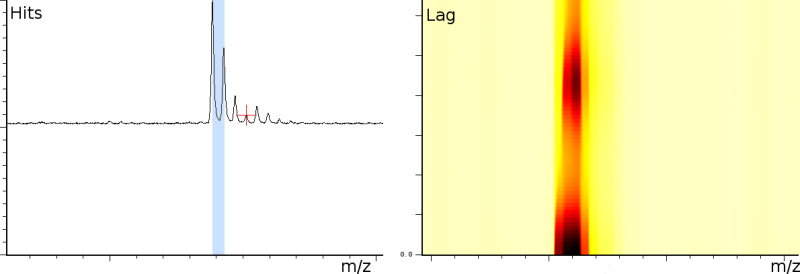
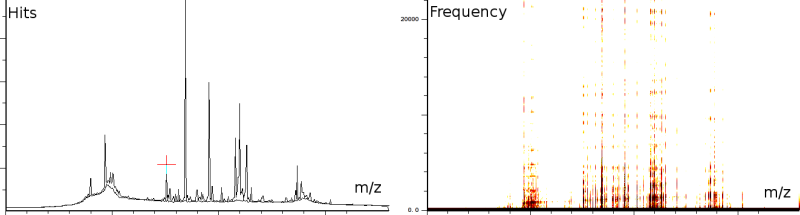
We first tried the creation of a number of digital notch filters. Because we don't want to shift the peaks back or forth in time, such a filter was required to have a zero-phase response over its entire spectrum. Also the impulse response of the filter needed to be as short as possible because we did not want to broaden the peaks, nor introduce unwelcome echos. A number of small experiments indicates that the results of such a filter would not be so very good. It became also clear that the chirp could not easily be removed by such a time independent filter. Therefore we created a wavelet based technique of which the result is presented in figure 3a. A local closeup of the denoised data (figure 3c) shows how the peaks are located at the same places, but now allow for fully automatic detection. This makes it very attractive for high throughput proteomics.
Deconvolution & autocorrelation for automatic peak assessment
A phenomenon often used to assess the importance of peaks is the different mass of isotopes. For the same ionized fragment we will sometimes measure x Dalton, sometimes we will measure x+1 Dalton (if there is one neutron more), and so on. This knowledge can be used to automatically assess peaks as shown in figure 3b. The visualized graphic is the autocorrelation graph which measures whether a peak has 'echos'. If it has echos, then it probably is a series of peaks of the same fragment. through the use of deconvolution [GW02] we can then remove unwanted echos as well.
3 2D Gels
In proteomics 2-dimensional SDS-polyacrylamide gel electrophoresis (2D-PAGE) is the most widely used method for analyzing protein mixtures qualitatively. It combines two protein separation techniques. In the first dimension, isoelectric focusing (IEF), proteins are separated according to charge (isoelectric point, pI). In the second dimension, SDS-polyacrylamide gel electrophoresis (SDS-PAGE), proteins are separated according to size. This method is capable of resolving a significant portion of the total protein component of a cell and can give information about different post translational modifications (PTMs) attributed to the proteins at a given time. This proteomics method is therefore more informative about specific cell function at a given time than regular DNA analysis. english2D gels are commonly used to detect presence of certain proteins through spot detection [AKY+03]english. Recent advances in technology makes it also possible to measure quantitative differences in protein expression levels (E.g: up and down regulation). There is, however, a lot of noise and measurement biases which needs to be accounted for both in the localization of spots as well as in the quantitative measurement of protein expression.
Artefacts
|
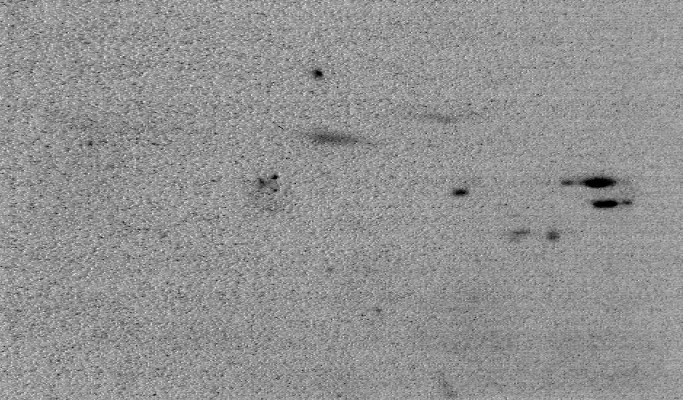
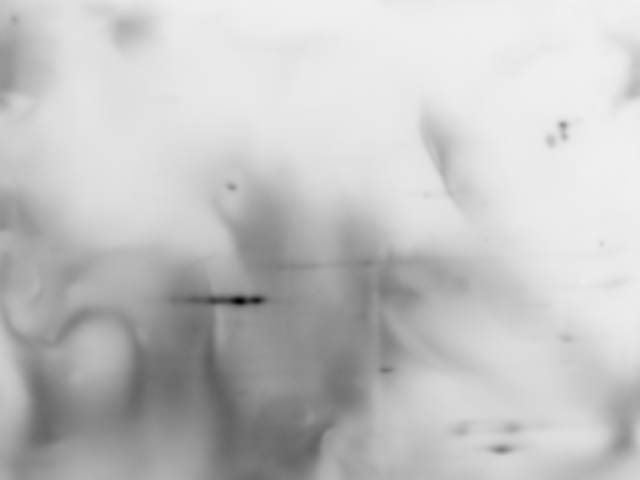
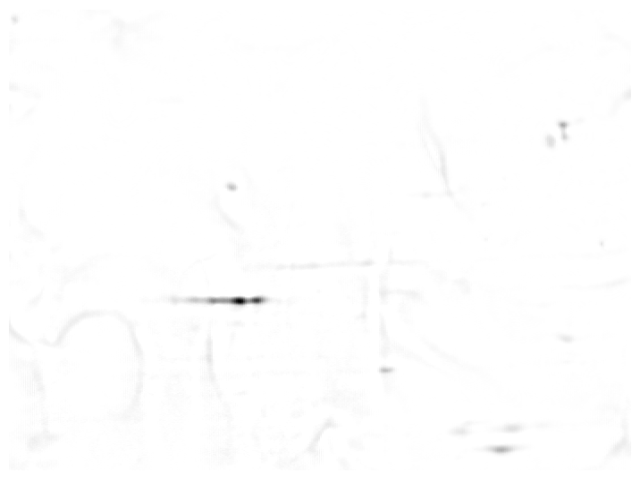
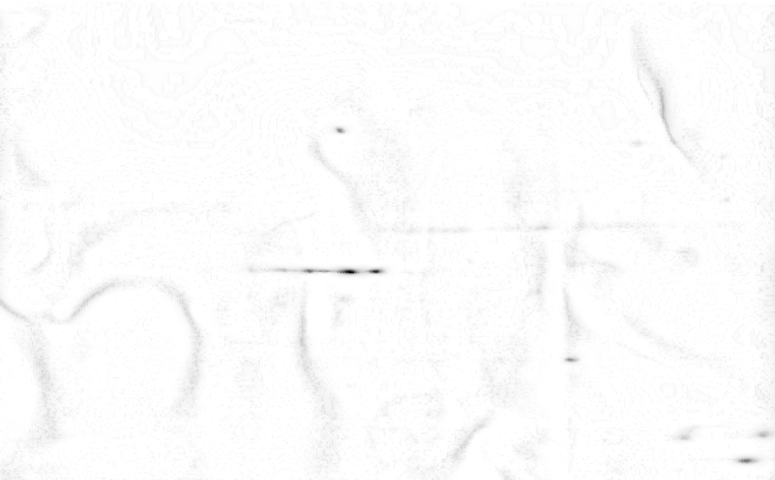
Common artefacts found in 2D gels are americanwhite noise if the signal intensity is low (figure 4), blurred areas, dots, salt and pepper noise, bubbles, clipping of grey value intensities and poor grey value resolution.
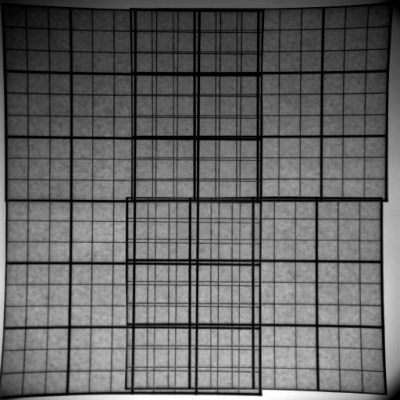
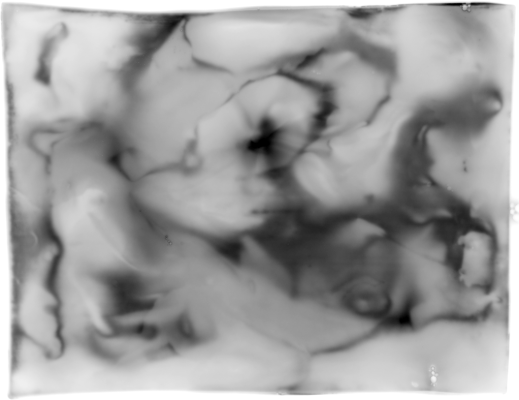
Handling of 2D gels might include washing and drying. Both operations lead to specific artefacts. americanWashing might lead to a modification of the image intensity in an inconsistent manner. This is typically a large scale effect that contains a large amount of energy spread over the entire surface area (see figure 6a). Automatic overlay and directional alignment algorithms [CP92,GW02] will tend to align these instead of the spots themselves. Drying artefacts reshape the content of a gel in a discontinues way. This is demonstrated in figure 4b.
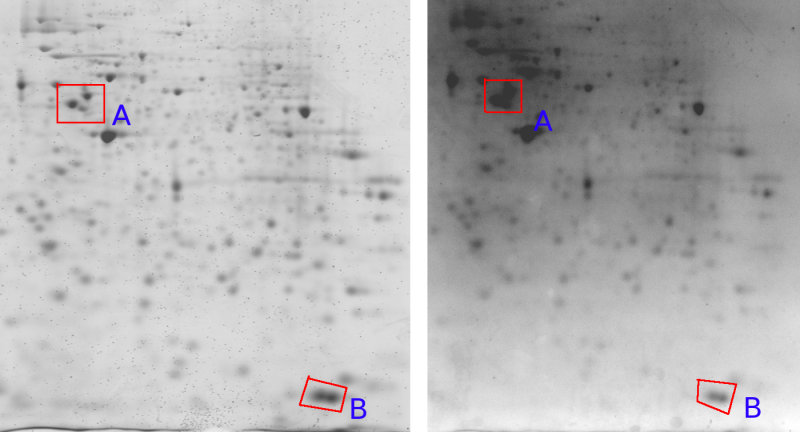
Other effects are introduced through the imaging hardware. Figure 4a shows lens warping of a Kodak Imaging station. The darkening at the sides and the non straight lines clearly indicate a major problem. Figure 5 shows one gel captured by two different cameras. An important observation here is that the relative grey value levels are not the same on the two machines. Area A shows three clearly differentiated spots for the Typhoon imager, while this area is a blur in the Kodak imager due to a too strong signal level (Kodak A > Typhoon A). On the other hand, the Typhoon imager observes darker grey values in area B than the Kodak imager (Kodak B < Typhoon B). This is a clear contradiction of which the cause lies in the different imaging approaches used by the two cameras. This example clearly indicates that normalizations of 2D gels, which is crucial for a scientific quantitative protein analysis, is still a challenging task [LK03].
Previous techniques for denoising 2D gels are based on thresholding, smoothing and spot recognition. Wavelet transformations [Cur04,GWD04,WF05] have also been applied to denoise 2D gels, however these techniques are typically in the frequency domain and they tend to shift spots slightly. Pipelining those different techniques is difficult due to the different assumptions under which every specific algorithm works.
Preliminary Experiments
|
We performed some preliminary experiments in the area of 2D gel denoising and analysis in cooperation with the Hematology Section at Haukeland Hospital. This cooperation lead to a novel denoising algorithm. The output of the algorithm is shown in figure 6b & 6c. The algorithm itself is currently under patent investigation. The Norwegian patent office recently reported back that the material was novel and a preliminary market investigation shows that patenting might be useful. The denoiser itself is online at http://bio3.itek.norut.no/denoiser/. The analysis method has been successfully applied to study p53 protein patterns in AML and ALL patients. Currently 3 manuscripts are written and waiting to be published [ÅBØBG05,BSÅ+ss,BAH+06]. The 2D gel images presented in this proposal are either made by Nina Ånensen (figure 4, 6a) or Gry Sjøholt (figure 5), in collaboration with Bjørn Tore Gjertsen.
4 NMR
  |
The last decade has seen an upsurge in the popularity and success of Nuclear Magnetic Resonance (NMR), for structural studies of proteins in solution. Spectrometers have benefitted from constant improvements in magnet and probe design. These improvements have yielded stable magnets at very high magnetic fields and the development of cryoprobes has increased the sensitivity even further, dramatically reducing the total experimental time required for data acquisition. Protein expression using 15N and 13C labeling is now technically and economically affordable for most labs and it has opened a new avenue in NMR since it allows the use of triple resonance experiments. In essence, NMR relies on NOE-type (Nuclear Overhauser Enhancement) experiments to provide information about the distance between atoms in space, information which in turn is then used to generate 3D models of proteins. However, understanding the information contained in NOESY experiments first requires exhaustive human intervention so as to determine the assignment of all protons present in the protein. Moreover, proton assignment cannot be done directly on NOESY experiments and thus the technique has to rely on the use of chain tracing experiments - those that connect the proteins atoms through bonds. The result is that the researcher produces an abundance of data through different experiments and then needs to invest a great deal of time in analyzing them independently. The main bottleneck of the NMR process still lies at the data-analysis step, called resonance assignment. The full resonance assignment is a pre-requisite in the process of NOE interpretation and this is the most time-consuming step of the process.
Several packages have been developed during the last few years to facilitate the assignment process, mostly at the sequential assignment level and with different degrees of success. All these programs suffer however from the high level of human intervention they require since very often they start from a clean of noise peak-list, meaning that the peak-picking step has been manually performed and artifacts were removed. To obtain in a fully automated manner the proton assignment of proteins the group of M.J. Macias has designed a completely new strategy for triple-resonance NMR data interpretation and peak-picking. This strategy is based on the use of soft-thresholding and specially designed convolution matrices, conceptually similar to the ones used in popular image processing software, but adapted to NMR problems to recognize peaks in NMR data sets. However an important source of false positives when performing automated peak-picking is to correct sporadic noise and to eliminate phase problems around intense peaks. Therefore algorithms that correct the noise will improve and facilitate the process of peak recognition greatly.
The problems we see in the images produced by the spectroscopy look similar to problems encountered in MALDI spectral output. Several methods for software based NMR signal enhancement have been published [AF01,CVDV94,LJM97,ACM+00,JDJ97]. Due to the loss of information in contour extraction algorithms, we will immediately work on the signal output as produced by the machine. Developing denoising algorithms at this level will allow for much better denoising applications than ordinarily possible on the interpreted images. In the project we will first acquire data from the machines and verify published filtering techniques and their abilities to solve the noise problems encountered by the users involved in the project. After that we plan to go into the physical understanding of the noise level and subsequently we will investigate denoising algorithms.
5 Project description
In this proposal we apply for financial support for 2 persons at Norut IT. One post doctoral position in signal processing and one PhD student with expertise and interest in different areas of biotechnology. The research project will be conducted at Norut IT in cooperation with Haukeland Hospital's hematology section, the department of medical genetics at the university hospital of North Norway, the Proteomics Unit in Bergen (Probe), the NMR Lab A21PB ICREA-IRBB-PCB at the Structural Biology Department in Barcelona (Spain), the Department of Virology at the University of Tromsø and the Department of Biomedicine at the University of Bergen. Validation of the project will be conducted by the different partners. Development of the algorithms will be conducted at Norut IT. In order to perform lab-experiments we would also like to include a budget covering experimental costs.
The project is set up as a 3 tier research program in which we parallelly investigate Mass Spectrometry, 2D gels and NMR. The work-plan is presented below. Care is taken to interweave data acquisition, development and publication in sections of 3 months each. At the end of the project we will approach the different industries with the developed algorithms. Depending on the application, this can be done through licensing, on-site development or through patenting. The coordination of the different activities will be led by Dr. Werner Van Belle at Norut IT. We would also like to include a 20% administrative overhead for project management. This is especially important given the various different groups we will be working with. Funding is necessary for travel between Bergen, Tromsø and Spain. The project aims to be as practical as possible. We will transfer existing knowledge, currently available in the area of earth observation, to a biomedical/biotechnological environment. As such, communication and mutual publications are important. In order to attract attention outside the current user group, we will make the programs available online, such that all users interested in it can benefit from the development.
| Mass Spectrometry | 2D Gels | NMR |
|
|---|---|---|---|
| Spring 2006 |
Gathering data from different machines in different modi operandi |
Publication of 2D Gel denoising & feature extraction results | Gathering different NMR spectra & study of the particular underlying physics. |
| Summer 2006 | Removal of coherent noise | Development of suitable visualization options for volumetric images | |
| Autumn 2006 | Publication of mass spectrometry denoising results | Development denoising | |
| Winter 2006 | Public site for denoising of mass-spectrometric data | Development 2D gel analysis based on neighborhood consistency analysis. | Public site for denoising & normalization of NMR volumetric data |
| Spring 2007 | Public site for denoising, normalization, unwarping, feature extraction & structured analysis of 2D Gels | Validation by Maria Macias/Pau Martin | |
| Summer 2007 | Development automatic peak selector | Validation through cooperation with Haukelands Hematology section | Publication denoising and/or tandem denoising peak detection with Barcelona. |
| Autumn 2007 | Verification of automated analysis in cooperation with PROBE | Publication of 2D Gel analysis results | Targeting industry with denoising of NMR spectra |
| Winter 2007 | Publication peak assessment in cooperation with Probe. | Normalization of 2D gels: data acquisition | |
| Spring 2008 | Normalization of sample readings on different machines | Normalization of 2D gels: algorithmic development | |
| Summer 2008 | Public site for normalization of mass-spectrometric data | Vector field determination based on PDE's | |
| Autumn 2008 | Publication of mass spectrometry normalization results | Publication of 2D gel normalization results. | |
| Winter 2008 | Targeting industry with normalization and assessment results. | Targeting industry with normalization results. |
Advantages & Applications
The advantages offered by developing denoising techniques and investigating normalization techniques are manifold. Denoising and normalization will lead to
- more accurate interpretation of data.
In the case of MALDI
TOF denoising, we can remove the
 shift introduced through
the noise. For 2D gels, positioning of peaks can be performed better
if background artefacts have been removed.
shift introduced through
the noise. For 2D gels, positioning of peaks can be performed better
if background artefacts have been removed. - automatic analysis of data. By removing unwanted artefacts, which are normally ignored by the expert, we can speed up the analysis process and avoid human errors. This is especially crucial in high throughput proteomics, which is feasible only if the data can be analyzed and assessed automatically.
- quantitative approaches. Normalization of data over different machines is important if we are interested in quantitative data (as opposed to qualitative data). E.g; measuring up and down regulation of post-translational modifications using 2D gels or measuring protein content changes using MALDI and diagonal chromatography methods. These techniques are only scientific valid if the interpretation of an experiment is independent of the actual hardware involved. We already indicated (figure 5) how challenging this can be for even the most basic technique: 2D Gels. Clearly there is an urgent need for a better understanding of the different machines and techniques involved. The best way to create such an understanding is by making conversion routines and normalization routines.
- understanding technique related errors. An important side effect of this research is that we will be able to quantify the experimental errors related to every specific technique. Currently there is very little known in this area.
- software for FUGE. The methodology we will develop may form part of the national FUGE platform and can be beneficial for basic and clinical research projects in multidisciplinary fields. E.g: the technology might be very useful when comparing (phospho)protein patterns in unstimulated versus stimulated cells or in normal cells versus cancer cells. Appropriate handling of the data will facilitate the detection of alternatively expressed (or phosphorylated) proteins. Also protein patterns in normal tissue versus diseased tissue (E.g: normal brain tissue vs Huntington's disease tissue) or non infected versus virus-infected cells can be analyzed. The specific knowledge transfer we propose and the public availability of the software clearly indicates a large payoff factor.
Bibliography
- ACM+00] Summers A.R.,
Windishberger C., Klarhoefer M., Moser E.,
Alexander M.E., Baumgarter R., Somorjai R.L.
- A wavelet-based method for improving signal-to-noise ratio and
contrast
in mr images.
Magn. Reson. Imag., 18:169-180, 2000. - AF01] Osama A. Ahmed,
Moustafa M. Fahmy.
- Nmr signal enhancement via a new time-frequency transform.
IEEE Transactions on Medical Imaging, 20(10), October 2001. - AKY+03] Roy Anindya,
R. Lee Kwan, Hang Yaming, Mark Marten, Raman
Babu.
- Analyzing two-dimensional gel images.
Raport instytutowy, Department of Mathematics and Statistics, University of Maryland, August 2003. - BAH+06] Werner Van Belle,
Nina Anensen, Ingvild Haaland,
Øystein Bruserud, Kjell-Arild Høgda,
Bjørn Tore Gjertsen.
- Correlation analysis of two-dimensional electrophoretic protein
patterns and biological variables.
BMC Bioinformatics, 7(198), April 2006.
http://www.biomedcentral.com/1471-2105/7/198. - BM05] Werner Van Belle, Olav
Mjaavatten.
- Denoising of maldi tof mass spectra.
Proceedings of the VIIth European Symposium of the Protein Society (AOPC2005), 2005. - BSÅ+ss] Werner Van
Belle, Gry Sjøholt, Nina Ånensen,
Kjell-Arild Høgda, Bjørn Tore Gjertsen.
- Adaptive contrast enhancement of two-dimensional electrophoretic
protein gel images facilitates visualization, orientation and
alignment.
Electrophoresis, 2006, In press. - CP92] K. Conradsen,
J. Pedersen.
- Analysis of two-dimensional electrophoresis gels.
Biometrics, 48:1273-1287, 1992. - Cur04] S. Curch.
- Advances in two-dimensional gel matching technology.
Biochem Soc Trans, 32(Pt3):511-516, June 2004. - CVDV94] H. Chen, S. Vanhuffeland,
C. Decanniere,
P. Vanhecke.
- A signal-enhancement algorithm for the quantification of nmr data
in
the time-domain.
J.Magn. Reson., 109(1):46-55, 1994. - GW02] Rafael C. Gonzalez,
Richard E. Woods.
- Digital Image Processing, rozdzia/l 7, strony
432-438.
Prentice Hall, Upper Saddle River, New Jersey 07458, wydanie 2nd, 2002. - GWD04] A. Gorg, W. Weiss, M.J.
Dunn.
- Current two-dimensional electrophoresis technology for
proteomics.
Proteomics, 4(12):3665-3685, Dec 2004. - JDJ97] Antoine J.P, Barache D., Dereppe J.M.
- The continues wavelet trasnform, an analysis tool for nmr
spectroscopy.
J. Magn. Reson., 128:1-11, 1997. - LJM97] Y. Lu, S. Joshi, J. M.
Morris.
- Noise reduction for nmr fid signals via gabor expansion.
IEEE Trans. Biomed. Eng., 44:512-528, 1997. - LK03] Choe LH, Lee KH.
- Quantitative and qualitative measure of intralaboratory
two-dimensional
protein gel reproducibility and the effects of sample preparation,
sample load and image analysis.
Electrophoresis, 24(19-20):3500-3507, October 2003. - WF05] Xiuying Wang,
David Dagan Feng.
- Hybrid registration for two-dimensional gel protein images.
Third Asia Pacific Bioinformatics Conference (APBC2005), January 2005. - ÅBØBG05] Nina
Ånensen, Werner Van Belle, Øystein
Bruserud, Bjørn Tore Gjertsen.
- Correlation analysis of wild type p53 protein in risk
strateifcation of
cancer.
Ready to publish, 2005.
| http://werner.yellowcouch.org/ werner@yellowcouch.org |  |