| Home | Papers | Reports | Projects | Code Fragments | Dissertations | Presentations | Posters | Proposals | Lectures given | Course notes |
|
|
Correlations: P53 Isoform Biosignatures vs Biomedical ParametersWerner Van Belle1* - werner@yellowcouch.org, werner.van.belle@gmail.com Abstract : This deliverable compares 132 various biological parameters agains P53 ISoforms on 2D Gels of AML and ALL Patients.
Keywords:
P53 AML ALL 2DGel Correlation |
Introduction
Correlation can be measured between any two numerical data sets. In our case, the first data set is a set of images, and the second data set is a set of biomedical parameters. We used 8 different image-sets.Gel1: is an image set containing the first gels made by Ingvild
Gel2: is an image set containing the second gels made by Ingvild
Gel1&2: are all the images made by Ingvild
Old: are all the images made by Nina, excluding the X-ray images.
Films: are all the X-ray images made by Nina
AllWithoutFilms: is an image set containing all of Ingvilds and Ninas gels, excluding the X-ray images.
AllWithFilms: is an image set containing all of Ingvilds and Ninas gels, including the X-ray images. I believe that since the acquisition process is different between gels, these should be treated as unreliable.
OldWithFilms : is an image set containing all of Ninas gels, including the X-ray images. I believe that since the acquisition process is different between gels, these should be treated as unreliable. This is the analysis as done before.
Next to this collection of image sets, we also have a collection of parameter-sets. Each parameter-set is correlated to each of the 8 image sets. Of course, the limited overlap between the new and the old parameters limits the usability of the combined sets. And in cases that a parameter is available for both sets, it must be ensured that the new and old images can be pooled together (meaning that Ingvild and Nina must have followed exactly the same procedures). The image sets and parameters can be found in Report/imagesets-and-parameters.xls (excel format), Report/imagesets-and-parameters.ods (OpenOffice format) and Report/imagesets-and-parameters.html. Those files are based on the spreadsheets as provided by Nina (AML-Chemokine-cluster.xls, Cell paper data_Master Sheet.xls, Mastersheet_Nina.xls) and Ingvild (Patient numbers.doc).
Below
is a list of parameters which link
to html files. Each
parameter contains the image count, whether it is based on normal or
normalized images and the actual image. PDF files are also
available. In the PDF files, each image will list the number of
gel-images used in the top left corner. The image count for all
correlation-images is informative. Results produced with
too
few images might be biased by the little information available and must
be treated with caution.
The
full movies and images are direct
available in the directories
<parameter>/<parameter>-vs-old[-ns]. For instance
age/age-vs-old will contain the correlations between the age and the
old image set. The directory age/age-vs-old-ns, will contain the same
but will be based on normalized images.
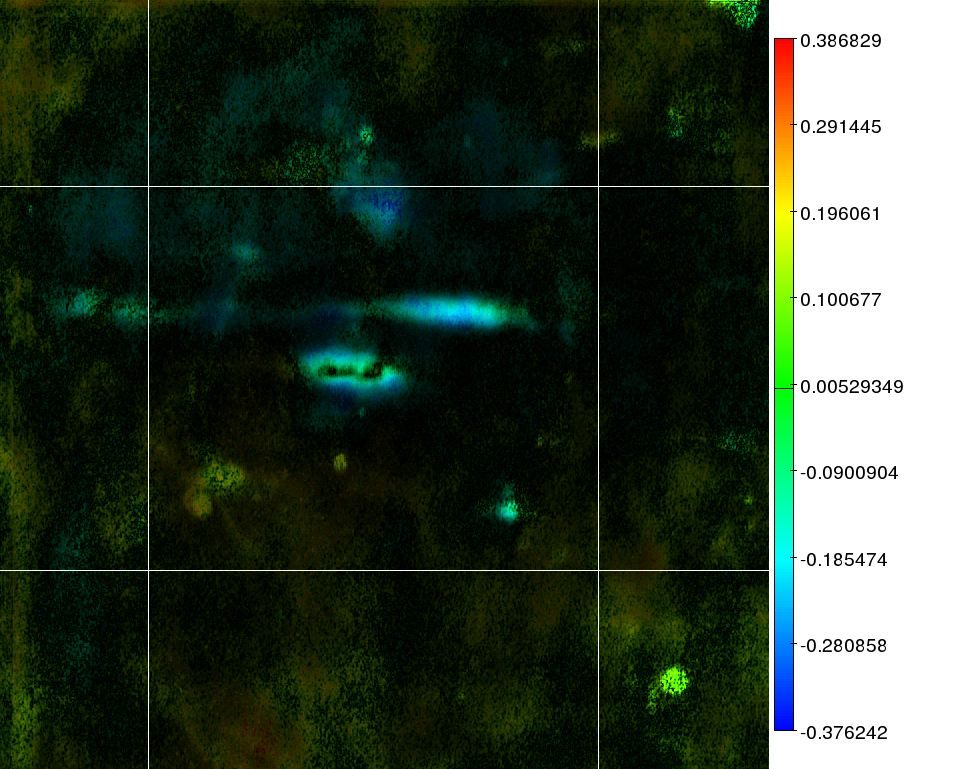
2D images:
the color reflects the
correlation as presented in the key next to the image. The
intensity
of an area reflects the joined mask based on the
standard deviation and the significance of that area. This is the same
mask as used in the Bioinformatics paper. A total overview of all
images is available as a PDF in everything.pdf.
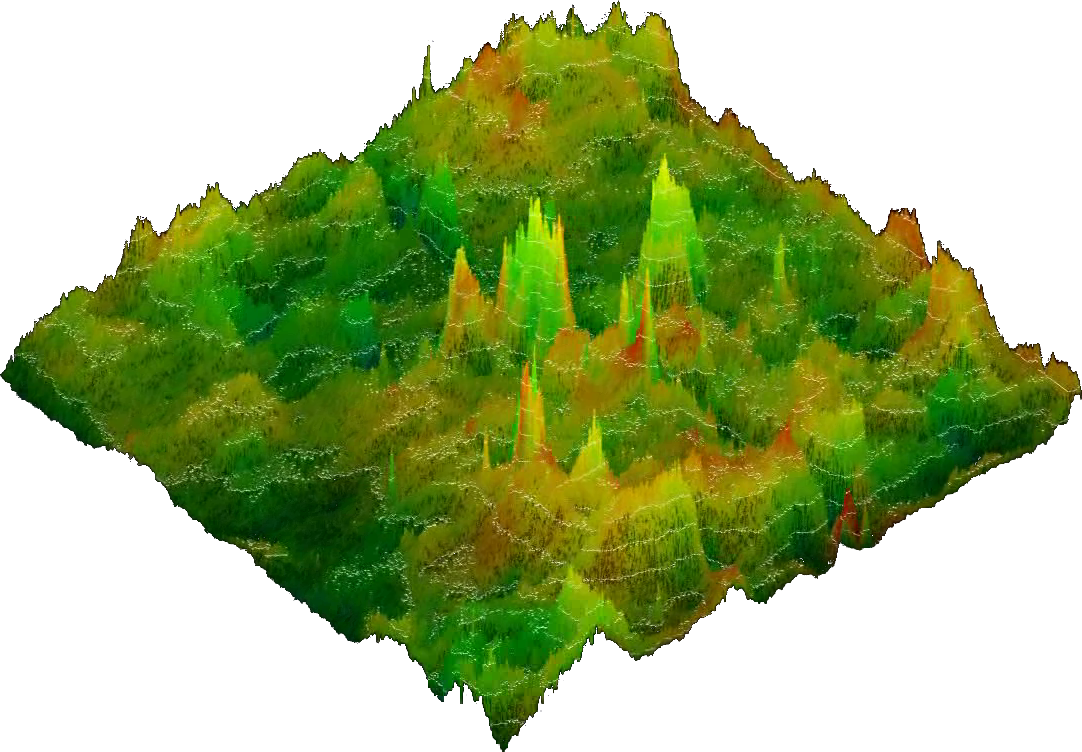
3D images
have the same
color code as reflected in the key
contained in the 2D image. The height of a position reflects the
combined mask of standard deviation and significance, but in
addition to the 2D images the correlation strength itself is
integrated as well.
The
correlation measure used is the
spearman rank order correlation.
They were calculated for the original images and the scale-normalized
images. This process involves translating the median of the grey
values to 0 and scaling the standard deviation of the area to become 1.
The normalisation factors are determined based on
the area contained within the white rectangle. All measures outside the
white rectangle have a correct correlation but the significance might
be too low. We filtered the data in such a manner to ensure that no
outliers outside the white boundary would remove the information
contained within the white rectangle. In the 3D images these areas will
be clipped.
Not
available. See
disclaimer above.
Demonstrator: fabm
Overlayed Gel
Images
The
overlay images are provided for
your information. The overlay was
based on input given by nina regarding the alfa and delta positions. We
further added the antibody spot and information based on the ladder.
All these pseudo-calibration points were used in combination with a
pair-wise alignment algorithm to maximize the overlap between any two
gels. Every overlay image contains a red and a blue component. The
overlay of all gel images is in Overlays/overlay.png.
The following table contains in the red channel the image and in the
blue channel the overlay. Note:
Due to technical reasons the images are flipped over the y-axis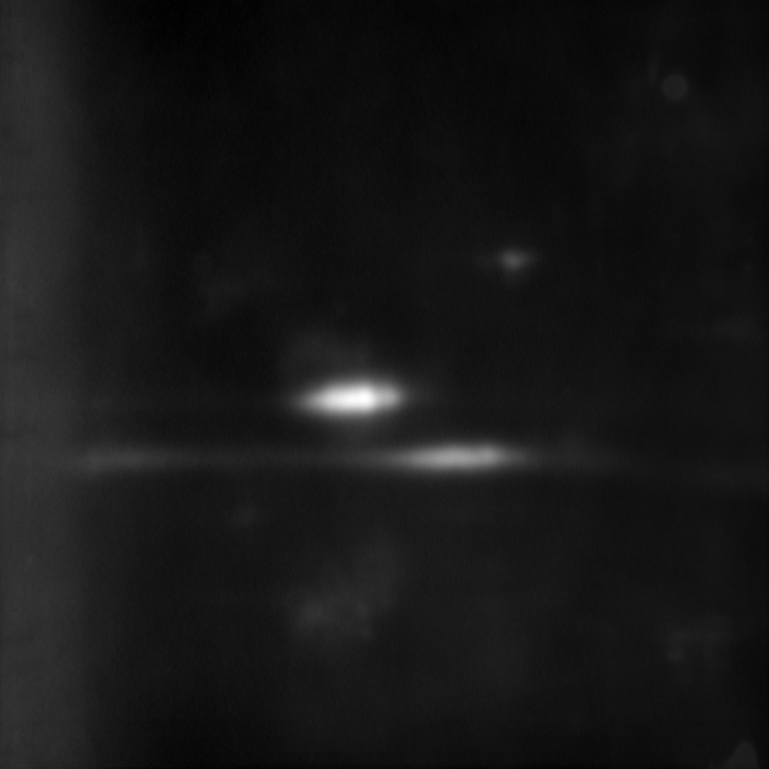
Not available. See disclaimer above
GelImages
The gelimages below are in 16 bit .TIF format as we received them for analysis.Not available. See disclaimer above
Raw 24 bit correlation data
The data produced by the correlation program is saved to disk using three files. Those are the correlation image, the standard deviation image and the significance image. These can be combined as necessary to have a proper visualisation (as done above). The data format for those images is a lossless PNG compression in which the RGB bytes are used to express one quantity ranging from the minimal value to the maximal value. For instance, if we have a correlation ranging from -0.4 to 0.3 then this range will be linearly mapped to numbers ranging from 0 to 16777215. Those values are listed in a separate file (Report/minmaxcor.* (.html, .ods, .xls, .csv) and must accompany the image before it is useful. The values listed in this file are extrema, meaning that only 1 pixel in the entire image might have this value, therefore we caution to use this file for any interpretation of the results. The directory raw24bit-cors contains the images for all of the calculated correlations.Potential areas of
Improvement
The
correlation process was repeated for
each image set with the
images 'as they are', and once more for each image set after
normalizing the image. This normalisation process has been described in
detail in the BMC Bioinformatics paper and seems to work relatively
well. However, a scientific approach should aim for the best techniques
available and normalisation does not necesarily outclass actual
measurement. It
could for instance have been very useful to improve on the following
points:
we were unable to assess the influence of the gel running time since this parameter was not recorded.
gels were not always positioned at the same place, which is bad since we know that the position on the plate has a strong impact on the results.
the camera seems unfocused and filthy. This should probably been have cleaned before acquiring the images.
calibration points were insufficient. The ladder to the left is too far out of the p53 scope to be useful. The actin spot could have been a useful position, if it was somehow related to the 2D gel images.
Part
of the reason we redid these
experiments was to have a better
understanding of these factors. It is a pity to notice that little
effort in that
direction has realized. Aside from this, there remain 3 other
points that might be of interest:
1. Bias Through Gel Removal
2.
Incomplete
Measurements (still living is not dead)
3. Unknown is not zero
Resource Usage
The computer resources necessary for this analysis were slightly larger than anticipated and it might be interesting to shed some light on execution times. All times are expressed on a 2.8 GHz Intel Pentium 4 processor with 1Gb of memory.- creating the fine-tuned overlay alignment: 72h
- computing all the correlations: 85.55h, which produced 5.8 Gb of raw data.
- rendering of the images: at 5 hours per image, with 1416 images:
7080h.
- A PowerEdge Dell workhorse with 4 Dual-Core AMD Opteron(tm)
Processors 8218; Cache: 1024 Kb;
Memory: 1608.
- 1 Intel(R) Pentium(R) 4 CPU 2.80GHz; Cache: 512 KB; Memory: 1004
- 2 Intel(R) Pentium(R) D CPU 3.00GHz; Cache: 1024 KB; Memory: 1006
- 2 AMD Athlon(tm) 64 Processors 3200+; Cache: 512 Kb; Memory: 1012
- 1 Intel(R) Pentium(R) 4 CPU 2.00GHz; Cache: 512 Kb; Memory: 1011
| http://werner.yellowcouch.org/ werner@yellowcouch.org |  |