| Home | Papers | Reports | Projects | Code Fragments | Dissertations | Presentations | Posters | Proposals | Lectures given | Course notes |
|
|
Propagating Differential Gene Expression in Protein Interaction NetworksWerner Van Belle1,2,3* - werner@yellowcouch.org, werner.van.belle@gmail.com Abstract : In a differential gene experiment, a cell perturbation can be measured on a microarray before and after the perturbation. The information from these microarrays can then be used to inference genetic pathways and protein-protein interaction networks. In this paper we reverse this idea somewhat and measure a cell perturbation through microarrays and then rely on a protein interaction map to assess which proteins are most likely influenced by the specific perturbation. This in turn helps to elucidate the functional effect the perturbation has on the cell system. The first part of the paper focuses on the propagation model we developed to obtain this information. The second part of the paper reports on a specific experiment that was driven by the interpretation we obtained through such a gene influence network. We applied a PC12 cell line that allows doxocyclin-dependent expression of constitutive active mitogen-activated protein kinase-activated protein kinase (MAPKAPK5 or MK5) to compare the transcription pattern in the presence or absence of doxocyclin by microarray analysis. The subsequent protein network analysis suggested that MK5 would affect anxiety. This finding was then confirmed by means of transgenic mice on an elevated plus maze and in a light-dark box.
Keywords:
microarray, protein interaction map, proteome, proteomics, influence mapping |
1 Introduction
Most single gene alterations (knock-in, knock-out) result in systemic effects in the cell by triggering a cascade of pathways. Microarray measurements of differentially expressed genes confirm this. After performing such experiments, one easily finds 2000 directly or indirectly affected genes. Some of these affected genes might hint at a specific function, however such an interpretation remains arbitrary since it does not take into account the wealth of information that is available. To alleviate this, gene ontologies can group genes according to their gene ontology classes [1]. However, such an approach is incapable of understanding interactions between various gene products. Therefore we set out to integrate microarray measurements into a protein interaction network. The overall idea is to use genes whose transcription is up- or down-regulated and place their anticipated gene products in a protein-interaction map. On this network we then run a propagation algorithm that cascades the signal throughout the network.
Modeling biological networks was historically first performed by means of coupled differential equations [2]. Afterwards, boolean networks have been used in which a gene does or does not promote another gene [3, 4, 5]. Symbolic approaches [6] such as the KEGG [7, 8] annotated database take this a step further and work with particular activation and inhibition patterns. Neural networks and continuous update networks have also been used to simulate gene transcription and regulation [9, 10, 11]. However in these networks, it turns out that noise forms a major problem. In general, few of the standard methods try to integrate protein interaction networks in their modeling approach.
Nevertheless, the creation of a signal propagation network based on a currated protein-protein interaction map is arbitrary as well. The choice of data sources, the choice of propagation algorithm and how we integrate a microarray measurement are all aspects that will influence the resulting network. Therefore, we first focus on 40 different models and investigate how these different factors influence the propagation model.
The second part of the paper reports on an experiment that was driven by such a gene influence network. Inter- and intra-cellular communications are pivotal for normal functioning of an organism and are accomplished by signal transduction pathways. Protein kinases, enzymes that catalyze phosphorylation of target proteins, are important compounds of many signal transduction pathways. One of these pathways is the mitogen-activated protein kinase (MAPK) pathway. This pathway regulates cellular processes such as proliferation, survival/apoptosis, differentiation, development, adherence, motility, metabolism, and gene regulation [12]. One of the MAPK components is the MAPK-activated protein kinase MAPKAPK5 or MK5. The biological functions of MK5 are poorly understood, but mice deficient in MK5 are more susceptible to chemical-induced skin cancer than their control littermates. Moreover, in vitro studies with MK5-/- cells revealed a role for MK5 as tumor suppressor.
To further elucidate the biological role of MK5, we studied the transcriptome in control cells and in cells expressing a constitutive active MK5 mutant by microarray analysis. The gene products of the differentially expressed genes were used in conjunction with a protein-protein interaction map and allowed us to predict putative functions of MK5. Based on the influence network, we anticipated that MK5 could be involved in anxiety-related processes. This assumption was confirmed when we examined the anxiety behavior of transgenic mice expressing constitutive active MK5 and control litter mates.
2 Algorithm
2.1 Overview
![\includegraphics[height=0.8\textheight]{/home/werner/ProteomeEffect/Paper/Images/BigPicture}](bigpicture.png)
|
The general idea behind the algorithm is to use two microarray measurements and translate their probes to the proteome. The proteome is internally modeled as a protein interaction map but since we only have a limited number of measurement points that correspond to proteins, we propagate the proteome influence throughout the network. This process is performed for the normal and the altered cell line microarrays after which we compare the two networks and report the results. Figure 1 depicts this process. We will now explain the algorithm in more detail.
The propagation algorithm requires the availability of a protein interaction map that is compatible with the microarray measurements. E.g: a mouse survey microarray could serve as input into a mouse protein interaction map. If there is no direct relation available, a homology mapping might be necessary [See table mappings report]. The interaction map can be based on experimental proven protein associations (e.g. yeast two-hybrid and co-immunoprecipitation experiments) combined with extensive literature searches which may imply putative functional protein-protein connections (e.g. identical phenotypes of two independent mouse models deficient in two different proteins). In our case we relied on the human protein interaction map as designed by Jean-Francois Rual and colleges in 2005 [13]. This interaction map provides both high and low confidence interactions.
2.1.1 Initialization
As a first step, the influence propagation algorithm loads the interaction
map into memory thereby representing each protein as a C++ object
[14]. The interaction levels/protein affinities are stored
as an STL map of target proteins and weights within the specific proteins.
Secondly, we initialize the current value of all proteins for which
we have a microarray measurement and set their initialization marker
to true. Depending on the model we either use the directly measured
microarray signal or we use a conservative interpretation of the signal.
The proteins for which we had no information (those which had corresponding
altered gene on the micro-array) were intialized with 0 (for type-I
networks) or 1 (for type-II networks) and an initialization marker
![]() which was set to false. To handle the problem that genes and
proteins have strictly speaking different accession numbers, we relied
solely upon the Ensembl gene identifier.
which was set to false. To handle the problem that genes and
proteins have strictly speaking different accession numbers, we relied
solely upon the Ensembl gene identifier.
2.1.2 Propagation
Once the network is loaded and initialized, we perform a series of updates to estimate the value of all non-measured proteins. Each protein its influence is recalculated by assessing what the influence would be if we had to calculate it solely on its neighbors. Updating the protein nodes happens synchronously in two stages. The first stage will calculate the new values based on all the neighboring proteins. Only when all new values are calculated will they be adopted for use in the next iteration.
In the notation below the variable ![]() refers to the signal strength
of protein
refers to the signal strength
of protein ![]() . E.g;
. E.g;
![]() refers to the signal interpolated
(or directly measured) for GABA. Each protein
refers to the signal interpolated
(or directly measured) for GABA. Each protein ![]() has a number
of neighbors in the protein interaction network which are annotated
in a matrix
has a number
of neighbors in the protein interaction network which are annotated
in a matrix ![]() where each pair of proteins has a weight. If two
proteins do not interact then
where each pair of proteins has a weight. If two
proteins do not interact then ![]() . When they interact the
weight
. When they interact the
weight ![]() is given by the probability that this interaction
is correct. These are taken directly from the paper by [13].
The network itself is undirected as such
is given by the probability that this interaction
is correct. These are taken directly from the paper by [13].
The network itself is undirected as such
![]() .
.
The formal updating of the network from one state tho the next is
done by calculating the new value of each of the proteins (nodes)
in the network. We annotate the new value as ![]() .
.
During updating, the mismatch between the newly estimated value and the old values is accumulated. This residue is given by
As is typical with this type of networks, the update can be performed until the total residue is minimal, or until sufficient iterations have been performed.
When the network simulation stops we cluster and visualize the results using the GEM/Frick layout algorithm [15] as implemented in Tulip [16].
2.2 Network Design Parameters
 |
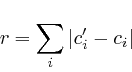
| Table:
The different models considered and tested.
In general the different models consisted of a combination of number
of variables. The 'Microarray' variable describes which microarray
data we include, which could be filtered and non-filtered.
The 'protein interaction map' variable involves the quality of the
protein interaction map, which could be only the highly significant
interactions or all described interactions (low). Depending
n the type of network we have some extra variables. Top) For type
1 networks, the interpreation of values could be as measured
or conservative. The latter means that we relied on the lowest
estimate of the gene regulation. The rescaling parameter could be the logratio
|
The propagation algorithm can a) simulate one network containing regulation ratios (called type I networks) or it can b) simulate multiple distinct networks, each containing one microarray channel. E.g. we can run a network simulation on the microarray output of the MK5 cells and another one on the microarray data of WT cells. Afterwards we compare the resulting networks. We call these type II networks.
For type I networks, we used various interpretation of the regulation
ratio. Among them the ratio of the two channels ![]() , the
log regulation ratio,
, the
log regulation ratio,
![]() , which is a widely
used reporting technique, although it is difficult to find a good
argument why it is so frequently used. As a last interpretation we
worked with the absolute value of the regulation ratio,
, which is a widely
used reporting technique, although it is difficult to find a good
argument why it is so frequently used. As a last interpretation we
worked with the absolute value of the regulation ratio,
![]() .
The reason we might consider using the absolute log ratio is that
the we do not want to have effects cancel each other out. For instance,
when the network propagates a down-regulation over one pathway and
an up-regulation over a parallel pathway, then at the junction of
these two pathways, we might find a turnover of proteins, which results
in no regulation alteration at all.
.
The reason we might consider using the absolute log ratio is that
the we do not want to have effects cancel each other out. For instance,
when the network propagates a down-regulation over one pathway and
an up-regulation over a parallel pathway, then at the junction of
these two pathways, we might find a turnover of proteins, which results
in no regulation alteration at all.
For type II networks we considered the following values: the microarray
measurement ![]() , the squared microarray measurement
, the squared microarray measurement ![]() and
the square rooted microarray measurement
and
the square rooted microarray measurement ![]() . The rooted
and squared values were used to see whether the light distribution
curve might affect the outcome of the simulation. In general the voltage
of a measurement is not always linear to the perceived amount of light
and this in turn might not reflect the actual concentration linearly
either. Finally we also relied on a ranking of the microarray data,
which was used as a robust interpretation of the microarray data and
will aside from flattening the entire microarray distribution, solve
the light intensity problem as well.
. The rooted
and squared values were used to see whether the light distribution
curve might affect the outcome of the simulation. In general the voltage
of a measurement is not always linear to the perceived amount of light
and this in turn might not reflect the actual concentration linearly
either. Finally we also relied on a ranking of the microarray data,
which was used as a robust interpretation of the microarray data and
will aside from flattening the entire microarray distribution, solve
the light intensity problem as well.
To compare the networks, and thereby assess the impact on the proteome, we relied on two comparison methods, in the first we calculate the absolute difference between the red and green network and rank the results according to the size of this difference. In the second method we ranked the results according to the size of the division of red by green. To have a proper sorting we will always divide the largest value with the lowest value.
We worked with two types of data: a low confidence interaction map and a high confidence interaction map, both made by [13]. The microarray data selection consisted of a) the measurements after filtering, b) the lowest estimate after filtering and c) the unfiltered data [Van Belle et al, 2007].
3 Results
The tables and results presented below rely on the data we obtained through the MK5 experiment which is only briefly described so far. In section 4 we describe the experiment in more detail. We experimented with 8 different type I models and 32 different type II models. Table 1 presents the different type 1 and type 2 models we experimented with. From the experiments with type I networks we learned that the regulation ratio is a very difficult representation to work with.
3.1 Type I networks
It turned out that each of the 8 type I networks would favor proteins
that are closely located to the microarray measurements. Mathematically,
if we would set each protein that was measured on the microarray to
1 and all the others to zero and simulate the network we would obtain
a specific value for each protein. This value is the reciprocal of
the distance to the microarray given by
 in which
 ![]() is the protein for which we want to know the expected
value and
is the protein for which we want to know the expected
value and ![]() is the shortest distance between protein
is the shortest distance between protein ![]() and protein
and protein ![]() . The correlation between the values simulated with
each measurement marked as 1's and the value obtained from a proper
simulation was 0.88.
. The correlation between the values simulated with
each measurement marked as 1's and the value obtained from a proper
simulation was 0.88.
As a result, the network would sort the proteins according to their distance to the microarray. Given that protein interaction maps are small world networks, and the average distance from highly connected proteins to the microarray measurements is low, mainly highly connected proteins would be ranked high. So, regardless of the microarray measurement, highly connected proteins would obtain a large 'expected influence'. To us, this seemed against the working of biological networks. We assumed that proteins that are highly connected will be more stable and in a sense form an ankerpoint for other proteins.
To alleviate this problem we studied two normalization schemes. In
both schemes, we ran the original network simulation and then one
or more calibration runs. The first normalization scheme relied on
a value of ![]() for all the input proteins. The second normalization
scheme used multiple calibration networks and assigned a random value
to each of the input proteins. For both normalization schemes, we
would afterwards compare the output of the microarray based run against
the calibration runs. Table 2 illustrates
the results of this approach. The expected column reports the signal
for a specific protein, when ran through a calibration run. The measured
column reports the signal for a specific protein in the simularion
when we used the proper input of the microarrays. The last column
takes the ratio from the expected to the measured signal. To a certain
degree this alleviated the problem of the distance to the microarray.
However, we still noticed that the variance at a specific protein
would now correlate towards the distance to the microarray.
for all the input proteins. The second normalization
scheme used multiple calibration networks and assigned a random value
to each of the input proteins. For both normalization schemes, we
would afterwards compare the output of the microarray based run against
the calibration runs. Table 2 illustrates
the results of this approach. The expected column reports the signal
for a specific protein, when ran through a calibration run. The measured
column reports the signal for a specific protein in the simularion
when we used the proper input of the microarrays. The last column
takes the ratio from the expected to the measured signal. To a certain
degree this alleviated the problem of the distance to the microarray.
However, we still noticed that the variance at a specific protein
would now correlate towards the distance to the microarray.
A last problem with type I networks is that certain regulation factors
can be ![]() . Such infinite proteins will eventually bring
the entire network to
. Such infinite proteins will eventually bring
the entire network to ![]() , or nan. We resolved this
by removing all the
, or nan. We resolved this
by removing all the ![]() values, which is not optimal because we omit
potentially important measurements. Also, since we cannot work with
values, which is not optimal because we omit
potentially important measurements. Also, since we cannot work with
![]() values, it was unclear how we could initialize the network properly.
To this end we relied on a initialization value of
values, it was unclear how we could initialize the network properly.
To this end we relied on a initialization value of ![]() , which is
not correct since no regulation as
, which is
not correct since no regulation as
![]() would be 0 when
would be 0 when ![]() .
.
3.2 Network Comparison
Given all the problems the propagation of a plain regulation ratio brought forth, we fell back to the propagation of the original signal in two separate networks and compared them afterwards. The value types we considered were the original microarray value, the square, square root and rank of the different values. The differences between squared, square rooted and measured microarray values was negligible in all cases.
3.2.1 Division
Dividing the ranked values seemed to provide the most robust estimation of the proteome influence (see the divided ranks table). Not only will it take into account those that change, it will automatically group proteins that belong to the same pathway. This can be explained by observing that a cluster of proteins that is altered, will altogether shift up or down in the ranking when that pathway is triggered. Dividing the new ranks by the old ranks will tend to be very similar for all the proteins belonging to the same cluster. If we don't work with rankings this is not necessarily true, and subtle alterations between the different protein interactions will scatter them in the final result.
When looking at the divided-values (as compared to the divided-ranks as above), we mainly found a difference in emphasis. Almost all proteins listed in the divided-values table would occur in the divided-ranks table in the first 150 elements. As illustration, the first 100 elements of the divided values table in general appear between position 100 and 200 of the divided-ranks table. This shows that the ranking versus the values method will affect the sorting and consequent emphasis, but not the qualitative results.
3.2.2 Subtraction
With the normal non-ranked values we found that the size of the original influences dictates to a large extent the ranking. Although this seems unnatural, it is possible to interpret this information as an absolute change in e.g. protein levels, so this approach could provide valuable data. On the other hand, looking at the data we found no extra value in this method to analyze the proteome. This is in line with the current practice of looking at ratios (fold changes) of transcriptional changes.
Subtraction in the ranked method does not work because the ranks of lesser affected proteins is numerically greater than the ranks of strongly affected proteins. This leads to sizeable rank-differences for relatively unimportant proteins, meaning that the end-result will report a large number of highly ranked proteins that are relatively insignificant. So subtractive methods did not work very well with the ranked microarray data.
3.3 Microarray Quality
We tested two different microarray inputs into our simulation. The first relied only on the microarray measurements that were sufficiently large. The second used all the measurements. In general, we observed that the high confidence microarray data provided more valuable results, which is not so surprising since the non confident microarray measurements are often the result of probe inefficiency on the microarray and thus the expected signal to noise ratio is very low.
In one of our type I network simulations we used the filtered microarray and the lowest boundary of the filtered data (which acts as a conservative interpretation of the data). These regulations are often substantial lower and will still indicate the direction of the regulation, but are much less prone to measurement errors because in 95% of the cases they will underestimate the real value.
To understand the effect such underestimation has on the network we compared the rank displacement between the different networks. If we look at the high confidence interactions we find that the average rank displacement between lowest estimate and normal data is around 575. This is an average displacement of 17% given the total number of elements. If we only take into account the first 100 elements, we have an average rank displacement of 3.7 (3.7%). For the first 500 elements this becomes 55 (11%). Not surprisingly, this indicates that a measurement error will affect the proteins that were already ranked at the insignificant end of the scale but will have little effect on the strongly affected ones.
3.4 Choice of Interaction Map
We experimented with two interaction maps, both created by [13]. In the first influence network, we only used high confidence interactions. In the second network we relied on the low confidence interactions. The results of these different simulations resulted in 3228 proteins for the filtered microarray measurement and 502 for the non filtered microarray measurement both for the high confidence networks. The low confidence interaction map reported 5061 proteins for the filtered microarray and 843 for the non filtered microarray. We found that the quality of the influence network decreased if we used too many low confidence interactions. This is not an unexpected structural effect of small networks: even a few wrong or unnecessary interactions will quickly connect all proteins to each other. This observation indicates that the quality of the interaction map is of great importance. It makes little sense to rely on strongly interacting proteins with a low confidence. In summary, in contrast to the high confidence interaction map, the low confidence interaction map did not provide particular valuable information.
4 Test case
To test our algorithm on a real dataset, we relied on 4 microarrays of MK5, of which 2 from an activated MK5 cell line, while the other 2 were from the unaltered cell line. First we performed a standard analysis and tried to assess the function of MK5 through gene ontology classifications. Afterwards we placed the micro array data in an influence network and deduced the function of MK5 based on the function of the estimated influenced proteins. These estimated proteins are not meant to predict an alteration in vivo. They only serve to provide information on the functional effect of MK5. As a third step, for each of the clusters we found, we checked the literature to see whether this function was already annotated or not. Finally we've set up a transgenic mouse experiment to validate our anxiety hypothesis.
4.1 Network Generation & Visualization
|
The functional analysis of the effect of MK5 on the cell system was
performed two times. The first time we used a type I network based
on the lowest estimate of the filtered microarray data. In this network
we propagated the
![]() values and compared it against a
values and compared it against a ![]() -initialized network through
division (see table 2). The second time,
we used a network of type II network in which we propagated the rank
of the filtered microarray data. The network comparison was again
performed through division (see the divided ranks table). In both cases we relied only on the high confidence interaction map.
-initialized network through
division (see table 2). The second time,
we used a network of type II network in which we propagated the rank
of the filtered microarray data. The network comparison was again
performed through division (see the divided ranks table). In both cases we relied only on the high confidence interaction map.
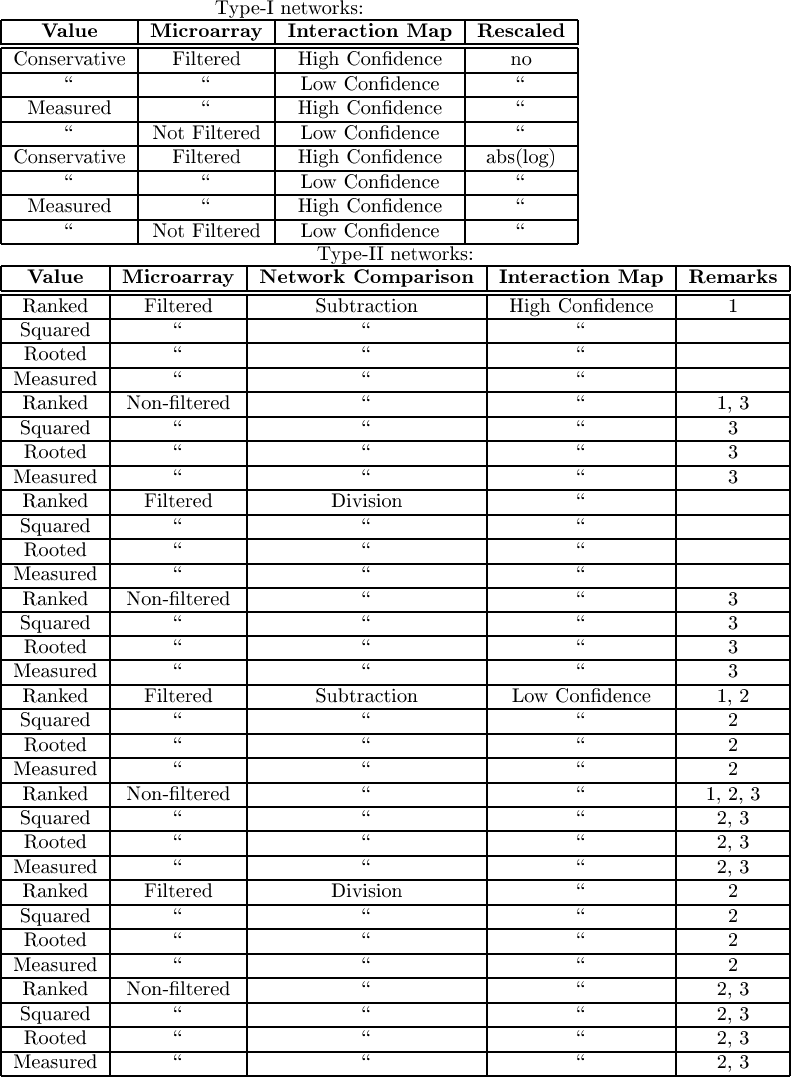
Figure 2 shows the top 500 deduced proteins from our type II network. The figure itself and the clustering was made using Tulip and the GEM/Frick layout algorithm [16, 15]. Interactions not linked to any of these proteins have been removed. The clusters are numbered from A to K and briefly described below.
- [A] Microtubule associated proteins / Cysteine endopeptidase / GABA-A receptor associated proteins
- [B] Protein phosphatases, Microfibril associated glycoproteins
- [C] Cyclic AMP dependent transcription factor, Transcription factors, polymerase, Fos related antigen and regulatories, high mobility group 20a, Sox-like swi/snf actin dependent regulator of chromatine
- [D] Guanine nucleotide-binding proteins
- [E] Serine/Threonine protein phosphatases
- [F] Glycogen phosphorylase
- [G] Neuronal voltage-gated/dependent calcium channel neuronal immediate early gene
- [H] Potassium voltage gated channel and potassium/kv channel interaction proteins
- [I] Myosin related proteins
- [J] Mitochondrial ribosomal proteins, which are mainly involved in metabolism
- [K] Huntington interacting protein, nucleolysin, sarcoplasmic reticulum and RNA processing proteins
Cluster B, E and F are related to protein phosphatases, which dephosphorylate
their substrates thereby often abrogating the activity of their substrate.
Based on their substrate specificity, these phosphatases can be divided
into several groups e.g. serine/threonine protein phosphatases like
PP1 (![]() ,
, ![]() ,
, ![]() ,
, ![]() ), PP2A (=PP2),
PP3(=PP2B=calcineurin), PP2C, PP4 and PP5 (Figure 2B,
2E, 2F). The regulatory subunit of PP1A
is altered in our protein influence map. PP1 (Fig 2E)
can dephosphorylate and thereby inactivate glycogen phosphorylase
(the latter enzyme breaks down glycogen into glucose subunits). Hence,
PP1, it plays a role in insuline resistance and glycemia variation.
PP1A can also dephosphorylate p53 at Ser-15 and Ser-37 and thereby
modulate transcriptional activity and proapoptotic ability [17].
), PP2A (=PP2),
PP3(=PP2B=calcineurin), PP2C, PP4 and PP5 (Figure 2B,
2E, 2F). The regulatory subunit of PP1A
is altered in our protein influence map. PP1 (Fig 2E)
can dephosphorylate and thereby inactivate glycogen phosphorylase
(the latter enzyme breaks down glycogen into glucose subunits). Hence,
PP1, it plays a role in insuline resistance and glycemia variation.
PP1A can also dephosphorylate p53 at Ser-15 and Ser-37 and thereby
modulate transcriptional activity and proapoptotic ability [17].
4.2 Discussion MK5 Influence Map
4.2.1 Neuronal function
The protein influence map described in this report suggests alterations for several neuronal proteins upon overexpression of activated MK5 in a cell line.
For example, the GABA A receptor associated protein (GABARAP), which belongs to the microtubule associated proteins (MAP) family, functions as a linker protein that connects the
![]() receptor to the cytoskeletal protein tubulin and is critical for long
term potentiation (LTP)[18, 19].
Since GABA receptors are involved in mediating anxiety-like processes,
it may well be possible that such mechanisms are regulated through
MK5 [20, 21, 22].
receptor to the cytoskeletal protein tubulin and is critical for long
term potentiation (LTP)[18, 19].
Since GABA receptors are involved in mediating anxiety-like processes,
it may well be possible that such mechanisms are regulated through
MK5 [20, 21, 22].
An activated receptor can transduce its signal via multiple ways e.g.
G-protein coupled receptors utilize G proteins for this matter. G
proteins exist as monomeric or heterotrimeric G proteins which bind
guanine nucleotides (Fig. 2d). They serve as molecular
switches between an inactive GDP bound and an active GTP bound state.
When active, they can activate or inhibit downstream signaling pathways.
For example
![]() increases the cAMP concentration (Fig.
2c) in the cell and thereby activates the PKA pathway,
whereas
increases the cAMP concentration (Fig.
2c) in the cell and thereby activates the PKA pathway,
whereas
![]() decreases the concentration of the same
second messenger and thereby inhibits the PKA pathway. Such signaling
pathways often converge in the nucleus where they affect the activity
of transcription factors. Transcription factors that respond to cAMP
(Figure 2c) are for example cAMP Responsive Element
Binding protein, CREB for short. This protein is one of the major
downstream substrates of PKA and plays an important role in several
neuronal processes [23, 24].
decreases the concentration of the same
second messenger and thereby inhibits the PKA pathway. Such signaling
pathways often converge in the nucleus where they affect the activity
of transcription factors. Transcription factors that respond to cAMP
(Figure 2c) are for example cAMP Responsive Element
Binding protein, CREB for short. This protein is one of the major
downstream substrates of PKA and plays an important role in several
neuronal processes [23, 24].
Junctophilines are located in the junctional membranes of excitable cells and are essential for channel crosstalk during cerebellar plasticity [25, 26]. Junctophilin 3 is especially localized in the brain and seems to play a role in a diverse range in neurological diseases[27].
Mice with a knockout for the gene necdin, which is involved in the Prader Willy syndrome, carray a defect in axonal outgrowth and fasciculation of different types of neurons (sympathic, retinal ganglion cells, serotonergic and catecholaminergic neurons) [28].
DOC-2A and 2B both regulate synaptic activity but due to their different sensitivities to calcium, they can translocate to the membrane at different depolarization frequencies [29] and finally neuralized-like functions as a determinant of cell fate in nervous system and it underexpressed in malignant astrocytomas [30].
Microtubule-associated protein 2 (MAP2), (Fig 2A) expressed in neurons as a hallmark for neuronal differentiation. MAP2 binds to and stabilizes microtubules and thereby plays a critical role in neurite outgrowth and dendrite development[31] (Tau is a MAP. When phosphorylated it binds to tubulin to promote polymerization and stability of axonale microtubules. Abnormal phosphorylation is associated with Alzheimers disease.)
Deltex, can inhibit Notch-1 mediated expression of proneuroal genes, whereas Wingless signaling alleviates this repression. Notch-1/Deltex signaling may also play a general role in the repression of wingless target genes [32].
Another developmental active gene, Dgcr14, DiGeorge Syndrome Critical Region 14, lies in a gene cluster that is responsible for developmental disorders. The gene products are involved in mRNA processing, nervous system development, RNA splicing. Polymorphisms in the Dgcr14 promoter region occur more in schizophrenic populations than in control populations [33].
![]() -arrestin 1 (arrestin-2) and
-arrestin 1 (arrestin-2) and ![]() -arrestin
2 (arrestin-3) can affect desensitization and trafficking of GPCRs
in neuronal cells [34].
-arrestin
2 (arrestin-3) can affect desensitization and trafficking of GPCRs
in neuronal cells [34].
|
![\begin{table}\begin{centering}
\includegraphics[width=0.9\textwidth]{/home/werner/ProteomeEffect/Paper/MouseTable1}
\par
\end{centering}\par\par
\end{table}](img97.png) |
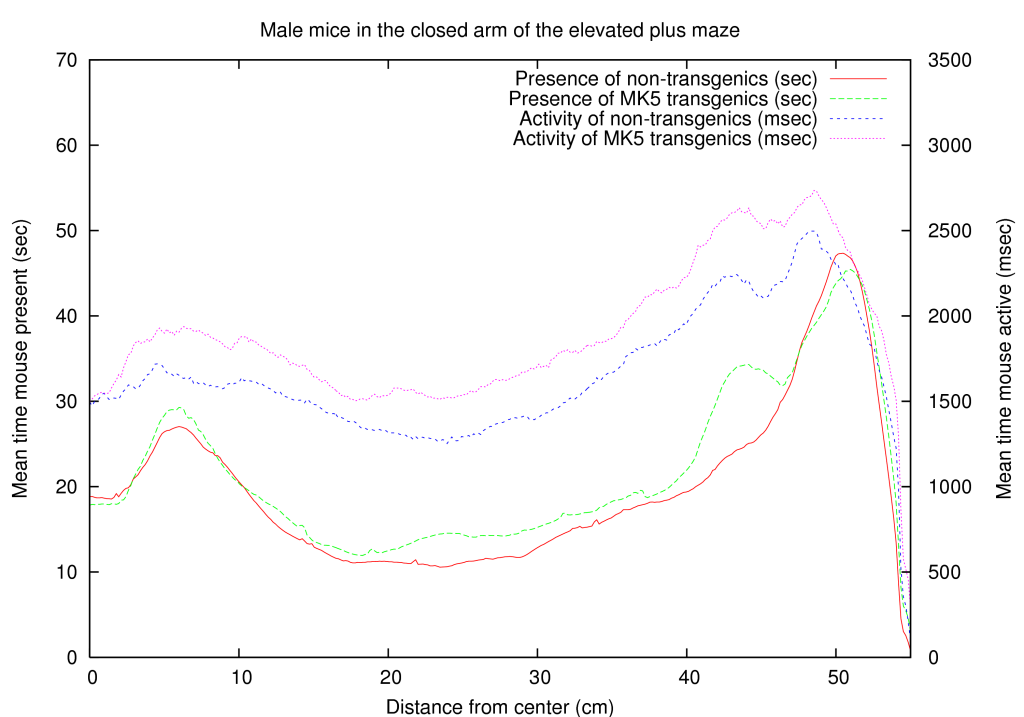
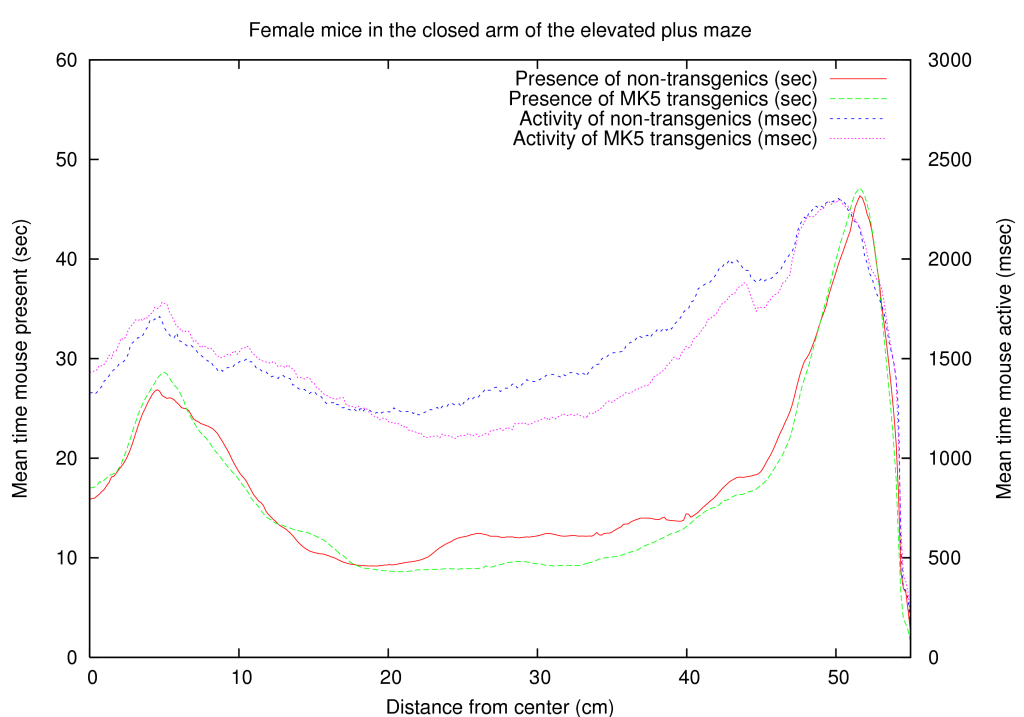
Because a neuronal function of MK5 was novel information, we used an existing mouse line, transgenic for constitutive active MK5, to test a hypothesis for anxiety. We placed the mice on an elevated plus maze and in a light dark box. Both tests are commonly used to measure anxiety in mice. A summary of these results is shown in table 5. A full coverage of the positioning of male/female, transgenic/non-transgenic mice on the close arm of the elevated maze is presented in figure 3. Interestingly one of the effects we observed is that certain mice are interested in a specific line on the elevated maze (they are active around this line), while MK5 transgenic mice behave differently around this area, indicating a psychological effect of MK5. Briefly, mice that overexpress a constitutive active form of MK5 display gender-dependent differences in anxiety-like behavior, indicating a first role for MAPKAPKs in neuronal processes [Gerits, Van Belle, Moens 2007]. This confirmed our hypothesis and thereby also supports our influence mapping algorithm.
Finally, essential for the functioning of neurons are Ca![]() channels.
Our protein interaction map shows that the
channels.
Our protein interaction map shows that the ![]() subunit of voltage
gated Ca
subunit of voltage
gated Ca![]() channels are altered (Fig 2G,H). These
subunits downregulate Ca
channels are altered (Fig 2G,H). These
subunits downregulate Ca![]() channel activity by causing a shift
in voltage-dependent channel availability [35]. Although
this does not prove the proper working of our interaction map, our
microarray data (used to generate the influence map) showed that Ca
channel activity by causing a shift
in voltage-dependent channel availability [35]. Although
this does not prove the proper working of our interaction map, our
microarray data (used to generate the influence map) showed that Ca![]() and
K
and
K![]() channels were affected, thereby indicating a function of MK5
related to Ca2+ / K+ channels.
channels were affected, thereby indicating a function of MK5
related to Ca2+ / K+ channels.
4.2.2 Cytoskelet & Development proteins
The protein interaction map indicates an altered expression for cytohesin
(Fig 2D), a cytosolic guanine nucleotide exchange factor
for the ADP ribosylation factor (involved in intra-cellular vesicle
transport). Cytohesin plays a role in actin remodeling and can interact
through its N-terminal coiled-coil domain with G![]() and
and
![]() -arrestin2 [36]. Other proteins
that are affected but have not been proven to be linked directly or
indirectly to MK5 include a) ficolin precursors, oligomeric
serum proteins of collagen stalk and fibrinogen-like recognition domains
typical for collage triple helices [37]; b) microfibril
associated glycoprotein 1 (Fig 2B) can associate with
tropoelastin, which serves as a scaffold of microfibrils and is a
key component of elastic fibers [38]; c)
-arrestin2 [36]. Other proteins
that are affected but have not been proven to be linked directly or
indirectly to MK5 include a) ficolin precursors, oligomeric
serum proteins of collagen stalk and fibrinogen-like recognition domains
typical for collage triple helices [37]; b) microfibril
associated glycoprotein 1 (Fig 2B) can associate with
tropoelastin, which serves as a scaffold of microfibrils and is a
key component of elastic fibers [38]; c) ![]() -related
BTB binding proteins which bind to and reorganize actin filaments
(see section 4.2.3); d) microtubule-associated
protein 2 (MAP2), already discussed in section 4.2.1;
e) dab2 serves as surface positioning gene that provides epithelial
cell polarity. It can together with GIPC and SAP97 associate with
the cargo binding tails of myosin VI, (unconventional myosin)
an actin based molecular motor involved in endocytosis [39](Fig 2I). The earlier mentioned dab2 plays a
role in development since dab2
-related
BTB binding proteins which bind to and reorganize actin filaments
(see section 4.2.3); d) microtubule-associated
protein 2 (MAP2), already discussed in section 4.2.1;
e) dab2 serves as surface positioning gene that provides epithelial
cell polarity. It can together with GIPC and SAP97 associate with
the cargo binding tails of myosin VI, (unconventional myosin)
an actin based molecular motor involved in endocytosis [39](Fig 2I). The earlier mentioned dab2 plays a
role in development since dab2![]() mice die [40]and dab2
mice die [40]and dab2![]() mice crossed onto a p53
mice crossed onto a p53![]() mouse line
produce fewer female mice compared to male mice which appear at normal
mendelian ratios. Female mice become also sterile at 6 months of age
[41]. Another protein, the spermatogenesis associated
6 protein seems also to be involved in development of gender-related
characteristics but very little is known about its function.
mouse line
produce fewer female mice compared to male mice which appear at normal
mendelian ratios. Female mice become also sterile at 6 months of age
[41]. Another protein, the spermatogenesis associated
6 protein seems also to be involved in development of gender-related
characteristics but very little is known about its function.
Lastly, several cysteine peptidases (Fig. 2A), which degrade polypeptides, can modify the cytoskeletal structure by cleaving key compounds. Since particular cytoskeletal structures are associated with particular cellular functions, proteins like calpains play a regulatory role in cell motility, adherence and LTP [42, 43, 44, 45].
One of the earliest hints of cytoskeletal involvement was the observation
by Schumacher [46] that lethality of MK5 knock-out
mice on a C57BL/6 background could occur due to defects in cell motility.
A recent publication confirms that MK5 can indeed rearrange the F-actin cytoskeleton in a PKA-dependent way, although it is not know during which physiological processes this is important[47].
In the microarray analysis we also found a downregulation of the DAZAP2 gene. DAZ is involved in the repression of genes that induce female development and is exclusively found on the Y-chromosome and hence essential for male development [48].
A function for gender development was also found through our transgenic mice experiment [Gerits, Van Belle, Moens 2007]. Aside from the fact that the MK5-mice differ in their anxious behavior compared to WT mice, we also found a gender dependent anxiety treat. Figure 3 shows the differences between male and female mice for the wild type and MK5 mice in the closed arm.
4.2.3 Cancer related proteins
If we look at Figure 2 and try to understand the connections between different clusters we find not many cancer related clusters, although a number of specific proteins appear in the textual output. Below we document these proteins.
XPA binding proteins, RAD50 interacting protein 1 interact with XPA and RAD50 compounds of the DNA repair machinery. HLX1, a transcription factor whose polymorphisms together with polymorphisms of RAD51 increase the risk of therapy related AML [49].
Melanoma associated antigens (abbreviated MAGE) comprise -
amongst other MAGEs- hepatocellular carcinoma associated protein
and necdin. Several types of MAGE proteins are exclusively
expressed in tumor cells (cancer/testes antigen), whereas others are
expressed in normal tissue, where they are involved in normal cellular
functioning. The MAGE Necdin functions in the cell cycle
where it can interact with E2F-1 and thereby inhibit cell growth [50].
The fos-related antigens fra-1 and fra-2 are transcription
factors whose increased expression contributes to malignancy in hyperplastic
and neoplastic breast cancers [51, 52].
We also find ![]() -related btb domain-containing protein,
which is homozygously deleted in breast cancer, but also involved
in lung cancer [53, 54]. It exerts its function
in the carcinogenic process by altering the expression of genes or
by affecting their degradation, like regulating expression levels
of Cul3, an ubiquitin ligase that degrades cyclin E and thereby maintains
cells in quiescent state. Cyclin E on its behalf, interacts with cdk2
to promote proliferation by stimulating progression into the S-phase
of the cell cycle [55]. Interestingly, cdk2-associated
protein 1 and p19 are both altered in the protein interaction
map as well.
-related btb domain-containing protein,
which is homozygously deleted in breast cancer, but also involved
in lung cancer [53, 54]. It exerts its function
in the carcinogenic process by altering the expression of genes or
by affecting their degradation, like regulating expression levels
of Cul3, an ubiquitin ligase that degrades cyclin E and thereby maintains
cells in quiescent state. Cyclin E on its behalf, interacts with cdk2
to promote proliferation by stimulating progression into the S-phase
of the cell cycle [55]. Interestingly, cdk2-associated
protein 1 and p19 are both altered in the protein interaction
map as well.
Other proteins include: a) DOC-1, a subunit of the anaphase
promoting complex which plays a role as tumor suppressor in oral cancer
development [56]; b) RASAL-1, a RAS Ca![]() regulated
GTPase Activating Protein which is silenced through CpG methylation
in -amongst others- brain, skin and bladder tumors. Its constitutive
activity leads to inhibition of tumor cell growth because of RAS inactivation
[57]; c) T-LAK, a cancer/testes antigen highly
overexpressed in breast cancer and involved in early mitosis. It can
phosphorylate H3 histone and thereby stimulate growth processes [58];
d) LAG-1 (longevity assurance homolog), with homologues in
yeast, can increase C18-ceramide synthesis which results in reduced
telomerase activity. Since telomerase is normally active in 80 to
90% of the HNCS, a role for LAG-1 as tumor suppress seems appropriate
[59]; e) FBW7 functions in complex with an E3
ubiquitin ligase Cul1, which degrades cyclin E, in hematopoetic stem
cells and plays a role in adult T and B cell leukemias [60, 55].
In addition, it can also directly target Notch-1, c-Myc and cyclin
E for degradation [61, 62]; g) DAB2
regulated
GTPase Activating Protein which is silenced through CpG methylation
in -amongst others- brain, skin and bladder tumors. Its constitutive
activity leads to inhibition of tumor cell growth because of RAS inactivation
[57]; c) T-LAK, a cancer/testes antigen highly
overexpressed in breast cancer and involved in early mitosis. It can
phosphorylate H3 histone and thereby stimulate growth processes [58];
d) LAG-1 (longevity assurance homolog), with homologues in
yeast, can increase C18-ceramide synthesis which results in reduced
telomerase activity. Since telomerase is normally active in 80 to
90% of the HNCS, a role for LAG-1 as tumor suppress seems appropriate
[59]; e) FBW7 functions in complex with an E3
ubiquitin ligase Cul1, which degrades cyclin E, in hematopoetic stem
cells and plays a role in adult T and B cell leukemias [60, 55].
In addition, it can also directly target Notch-1, c-Myc and cyclin
E for degradation [61, 62]; g) DAB2![]() mice display uterine hyperplasia and ovarian preneoplastic morphological
changes at high frequency suggesting a role in tumor development [41].
Similarly loss of DAB2 seems to be an early event in esophagal squamous
tumorigenesis [63].
mice display uterine hyperplasia and ovarian preneoplastic morphological
changes at high frequency suggesting a role in tumor development [41].
Similarly loss of DAB2 seems to be an early event in esophagal squamous
tumorigenesis [63].
The above list of cancer related proteins is indicative. There are,
however, a number of published observations that appeared after 2005
(after the creation of the protein interaction map) that support our
interpretation of the influence network.
Sun and coworkers showed that knockout of MK5 results in an increased incidence of chemical-induced skin pappillomas [64]. The pathway involved signals through MK5 that phosphorylates p53 on Ser37 in a Ras-dependent way, which indicates that MK5 could play a role in cell cycle checkpoints after DNA damage [64, 65]as has been shown for its closest relative MK2 (A close family member of MK5, MK2, had been shown to phosphorylate and thereby inactivate cdc25 phosphatase, which is required for cell cycle progression at the G2/M checkpoint. In addition, it can halt S-phase progression in response to UV irradiation [66, 67, 68, 69]. UV irradiation often activates p53, a protein that induces a halt in the cell cycle in order to check DNA integrity. If the cell cycle has progressed beyond the checkpoint, or if DNA damage proves too extensive, p53 can induce apoptosis.). The protein interaction map identifies several proteins involved in repair of DNA damage (like XPA and RAD50) when MK5 is overexpressed and constitutive active.
Overexpression of an activated MK5 cell line, on the other hand, seems to upregulate Eph receptor B3, which plays a role in cancer and neuronal development, as shown by our microarray experiments [70].
EGCG, an unspecific MK5 inhibitor attenuates protein phosphatase 2A (PP2A), which dephosphorylates p53 on Ser 37 in response to DNA damage[65, 71] and plays a role in control of the G2/M checkpoint. It can function both as tumor promoter or suppressor depending on cell type or transforming agent.
4.3 Gene Ontologies & Gene Enrichment
As a test to verify whether existing techniques such as gene ontologies and gene enrichement analysis might provide the same insight we performed two extra tests.
As a straightforward analysis we relied on the ontology database [1]and determined for each class the average regulation and the number of genes in that class that were affected. Only classes that had at least 5 genes affected on the microarray were used. This approach has two effects: first, large classes will in general have a slightly lower average regulation because of the class size. E.g: the class 'biological process' will have many affected genes, but even more unaffected genes. This will pull down the average. Secondly, small classes with only a few genes in it can have strong average regulations, but since there are so few genes in that class they might not show up in the systematic view. These two aspects are complementary and the best way to read such data is to look at the broadly affected classes and the narrowly affected classes.
As such, we first looked at the broadly affected classes (number of projected affected genes > 80) and went down to the highly affected but smaller classes (number of projected affected genes >20). The results of this process are given in the gene ontology breakdown table. Based on this overall result we concluded that MK5 affects the metabolic processes and signal transduction. In hindsight we also found two narrow classes, GO:0006950: response to stress and GO:0006811: ion transport, which hints at a potential for anxiety related function. This was however only in hindsight and any normal interpretation of the microarray would skip over these two categories.
A second approach we relied on was to use organism specific ontologies
and see which genes where enriched/depleted [72]. The gene enrichment table presents the results on the gene association
mouse ontology from 2005. From the 239 elements with ![]() -value
-value ![]() ,
we found 18 categories clearly indicative of neuronal function (this
is 7.5% of the total list). These were olfactory receptor activity
(GO:0004984), neuropeptide hormone activity (GO:0005184), metabotropic
glutamate receptor signaling pathway (GO:0007216), dopamine receptor
activity (GO:0004952), voltage-gated ion channel activity (GO:0005244),
electron carrier activity (GO:0009055), nervous system development
(GO:0007399), visual perception (GO:0007601), potassium ion binding
(GO:0030955), sensory perception of sound (GO:0007605), sensory perception
(GO:0007600), detection of stimulus during sensory perception (GO:0050906),
neurotransmitter:sodium symporter activity (GO:0005328), synapse (GO:0045202),
calcium channel regulator activity (GO:0005246), cannabinoid receptor
activity (GO:0004949), neuropeptide receptor activity (GO:0008188)
and axon ensheathment (GO:0008366). Although this lists suggests that
the gene enrichment analysis provides useful information, it does
not suggest any functions related to cancer, metabolism nor to signal
transduction activities as known for MK5. Furthermore, most of the
elements in this list are broad categories and makes deducing specific
functions difficult. The protein interaction network analysis provided
for better clusters and functionally more relevant information.
,
we found 18 categories clearly indicative of neuronal function (this
is 7.5% of the total list). These were olfactory receptor activity
(GO:0004984), neuropeptide hormone activity (GO:0005184), metabotropic
glutamate receptor signaling pathway (GO:0007216), dopamine receptor
activity (GO:0004952), voltage-gated ion channel activity (GO:0005244),
electron carrier activity (GO:0009055), nervous system development
(GO:0007399), visual perception (GO:0007601), potassium ion binding
(GO:0030955), sensory perception of sound (GO:0007605), sensory perception
(GO:0007600), detection of stimulus during sensory perception (GO:0050906),
neurotransmitter:sodium symporter activity (GO:0005328), synapse (GO:0045202),
calcium channel regulator activity (GO:0005246), cannabinoid receptor
activity (GO:0004949), neuropeptide receptor activity (GO:0008188)
and axon ensheathment (GO:0008366). Although this lists suggests that
the gene enrichment analysis provides useful information, it does
not suggest any functions related to cancer, metabolism nor to signal
transduction activities as known for MK5. Furthermore, most of the
elements in this list are broad categories and makes deducing specific
functions difficult. The protein interaction network analysis provided
for better clusters and functionally more relevant information.
5 Discussion
There are a number of interesting observations one can make with respect to the network simulations we performed
Noise Cancellation
Equation 1 reflects the idea that some form of balance will be achieved between different protein concentrations or protein regulations and it works quite well in practice. There are two reasons why this could be the case. First, using an interpolating method should cancel out variabilities in gene expressions, so if we have multiple measurements around a specific protein then the information available for this one protein will be more stable (= less prone to measurement errors) than any of the single measurements.
Interpolation in small world networks
A second observation is that interpolation is a technique that works quite well in small world networks since each node is quickly connected to all neighboring nodes. This means that one specific wrong measurement cannot bring the entire network out of balance. Also we do not expect that missing information has a big effect on the overall network interpretation afterwards since there will be always a multitude of other pathways that lead to the same influences. This effectively means that we in our simulation harvest the most important property of small world networks: robust towards missing information (links) and fault tolerant towards measurement errors. This is consistent with the literature that shows that linear interpolation often works better than more complicated methods[73].
6 Conclusion
We presented a method to estimate the effect a gene alteration has on the proteome. The output of these simulations should be treated as qualitative, not quantitative. It is indeed unlikely that all of the presented proteins are altered in-vivo according to the influence mapping. On the other hand, because the network is aware of the connectivity between different proteins it provides extra value to the researcher by focusing on pathways, functions and connections that are either already known or potentially possible. These pathways can then give reliable hints on the systematic effect of the original cell system alteration.
We tested our method on the MK5 gene and found that a number of specific functions came out. These were, in order of abundance, neuronal-, cancer-, cytoskelet- and development- related functions. Some of these functions were known before 2005 ([46]who showed development and cytoskelet related functions), or verified after 2005 ([64, 47, 74]who show involvement in cancer related processes and cytoskeletal processes and that MK5 is involved in PKA-induced microfilament rearrangement). There were also a large number of proteins for which we had no direct verification, but which nonetheless hinted at well defined functions. Such unverified but functionally related proteins can guide future experiments and help the researcher to set up successful experimental designs and hypothesis.
A particular example of such approach was the prediction that MK5 could affect anxiety. This we validated through an elevated maze experiment and light-dark test. Mice expressing a constitutive active MK5 mutant demonstrated anxiety-related traits and locomotor differences compared to their control littermates [Gerits, Van Belle, Moens 2007]. Furthermore, not only did we find changes in anxiety behavior, they were also gender dependent, which explains the occurrence of certain development related proteins such as spermatogenesis associated protein 6. Compared against the original microarray data, we were able to present new views on the data that were virtually impossible to obtain manually from the microarray measurement.
We performed 40 different simulations and found that type II rank propagation is a very robust method, which if combined with the high confidence interactions and filtered microarray data provides reliable proteome information. The main difference between divided-values and divide-ranks methods lies in the emphasis, but does not change the output qualitatively. The quality of the protein interaction map affects the outcome of the simulation. One should favor high confidence interactions since low confidence interactions might make the network much less usable. The same is true for the microarray data. Relying on a 95% confidence interval improves the results substantially.
Material & Methods
Microarray
For the MK5 experiment, we made 4 slides, two containing an induced (Cy3) sample and two containing an uninduced sample (Cy5). Samples were labeled with the 3DNA 350S HS labeling kit (Genisphere). The slide layout was a KTH Rat27K Oligo microarray Operon v3.0. A Tecan HS 4800 scanned the microarrays and the images were analyzed using the Genepix 4000B (Molecular Devices), which reported a constant gain of 950/800. We obtained more than 70% hybridization (measured as #spots > median + 1SD). Spots with too large an intensity (> 90% of the maximum) or too large a regulation (> x10) were removed. The data was quantile normalized according to [75]. Subsequently we modeled the probe measurement errors/efficiency according to [Van Belle et al, 2007] and filtered out those regulations for which the 95% confidence interval was inconclusive. The full microarray results are available online at http://analysis.yellowcouch.org/mk5/mk5.php. The microarray measured 15500 genes through 27000 probes. 19% (2667) of the genes were significantly affected.
Gene Ontology & Gene Enrichment
The gene ontology averages were calculated using a number of MySQL queries in conjunction with a copy of the gene ontology database. The full data is browsable at http://analysis.yellowcouch.org/mk5/go.php. To avoid a bias from the microarray (which design might by coincidence favor specific ontologies), we rescaled the number of affected genes based on the number of sampled genes. When looking at gene ontology classes it is important to note that they can contain each other. So to compare classes one should, as a rule of thumb, use classes of a similar size and take the class size into account. Furthermore, gene ontologies are a directed acyclic graph, which does not imply that they are a tree. In other words: each class can belong to multiple parent classes.
Gene enrichment was performed on the mouse gene ontology association database (goa-mouse) from 2005, checked out with CVS. The gene association tables and mk5 gene ontology tables were merged using MySQL. The gene enrichment analysis was calculated with a C++ program following [72]. Only p-values below 5% were retained. The data is available at http://analysis.yellowcouch.org/mk5/ge.php. The gene enrichment analysis relies on a counting method which does not take into account the actual regulations. It also does not account for a bias caused by the microarray slide design.
Transgenic Mice
For the construction of the ![]() mice, 170 fertilized C57BL/6xCBA
F2 eggs were injected with the linearized
mice, 170 fertilized C57BL/6xCBA
F2 eggs were injected with the linearized
![]() fragment
(2.5kb) at the Norwegian Transgenic Center in Oslo. From the 170 injected
eggs, 47 offspring developed to term (=27% survival), of which 8
carried the TG (=17%).
fragment
(2.5kb) at the Norwegian Transgenic Center in Oslo. From the 170 injected
eggs, 47 offspring developed to term (=27% survival), of which 8
carried the TG (=17%).
Positive founders and subsequent generations of transgenic mice were
identified by PCR with CMV and MK5 primers as described in [Gerits, Van Belle, Moens 2007].
To assure that the lack of HA-MK5 DNA in the PCR was not the result
of insufficient DNA or low DNA quality, ![]() -globin primers were
used to amplify
-globin primers were
used to amplify ![]() -globin DNA sequences. For the background
breeding, we crossed three female founders with male C57BL/6 WT mice
to produce the first generation of transgenic mice. Subsequent transgenic
generations were bred to background with WT C57BL/6 mice for 7 generations,
whereby each generation was screened for transgenic positive offspring
by PCR. The expression of the transgene was verified by RNA isolation
from mouse heart tissue. More information on the transgenic mice can
be found in [Gerits, Van Belle, Moens 2007].
-globin DNA sequences. For the background
breeding, we crossed three female founders with male C57BL/6 WT mice
to produce the first generation of transgenic mice. Subsequent transgenic
generations were bred to background with WT C57BL/6 mice for 7 generations,
whereby each generation was screened for transgenic positive offspring
by PCR. The expression of the transgene was verified by RNA isolation
from mouse heart tissue. More information on the transgenic mice can
be found in [Gerits, Van Belle, Moens 2007].
The association values between mice and the number of times they vocalized,
bit or jumped were calculated using contingency table analysis by
means of the algorithm given in [76]. The significance
levels were calculated using Yates correction[77] since all
variables could only take on two values. The probabilities that these
values could be a random effect was calculated (p-value) using a standard
![]() distribution with 1 degree of freedom. The probability
that the experiment can be repeated and will give the same value was
calculated (p-rep) according to [78]. The numerical output
of the elevated maze and light-dark test was grouped into female/male
transgenic/non-transgenic mice. For each group the standard deviation
and mean were calculated. The difference of the means was calculated
as well as the standard deviation of the difference. A one tailed
T-test was performed to assess the significance of each measured difference.
When the variance of the two groups was the same we relied on the
homoscedastic T-test, otherwise we used the heteroscedastic T-test.
We refrained from performing an ANOVA because most of the data did
not show a Gaussian distribution.
distribution with 1 degree of freedom. The probability
that the experiment can be repeated and will give the same value was
calculated (p-rep) according to [78]. The numerical output
of the elevated maze and light-dark test was grouped into female/male
transgenic/non-transgenic mice. For each group the standard deviation
and mean were calculated. The difference of the means was calculated
as well as the standard deviation of the difference. A one tailed
T-test was performed to assess the significance of each measured difference.
When the variance of the two groups was the same we relied on the
homoscedastic T-test, otherwise we used the heteroscedastic T-test.
We refrained from performing an ANOVA because most of the data did
not show a Gaussian distribution.
Author Contributions
Werner Van Belle performed the simulation, analyzed the microarray data while working for the University Hospital of Northern Norway. The manuscript was written at the Department of Biosystems Science and Engineering in Basel/Switzerland. Nancy Gerits performed the microarray experiment and transgenic mice experiments while working at the Department of Microbiology and Virology, University of Tromsø. She helped writing the MK5 section of the manuscript while working for the Department of Physiology, University Of Basel, Switzerland. Ugo Moens designed the biological experiments, helped writing and provided funding.
Appendix: Detailed Algorithm
The set_total method will calculate the total weight of
all outgoing interactions and store it in ![]() . The value
. The value ![]() is
the current influence value. Field
is
the current influence value. Field ![]() is set when the protein is
an initialization, which means that we have a microarray measurement
for it. If a protein is an initialization protein, then its
is set when the protein is
an initialization, which means that we have a microarray measurement
for it. If a protein is an initialization protein, then its ![]() value
cannot change because we don't need to estimate the influence if we
have a direct measurement. The value for the next generation of the
network is stored in
value
cannot change because we don't need to estimate the influence if we
have a direct measurement. The value for the next generation of the
network is stored in ![]() . The
. The ![]() field is the Ensembl gene identifier.
field is the Ensembl gene identifier.
![]() is the protein influence value for the next iteration and is
calculated in the first stage of the updaing process. The second stage
of the updating process will will transfer the
is the protein influence value for the next iteration and is
calculated in the first stage of the updaing process. The second stage
of the updating process will will transfer the ![]() value to the
value to the
![]() value through the adopt_next_value method. The static
variable
value through the adopt_next_value method. The static
variable ![]() accumulates the overall residue in the network. In the
code below the
accumulates the overall residue in the network. In the
code below the ![]() pointer is refered to as
pointer is refered to as ![]() withn the Protein
class methods. So
withn the Protein
class methods. So ![]() is essentially the same as
is essentially the same as ![]() . The variable
. The variable
![]() (=
(=![]() ) is the preprocess sum of weights.
) is the preprocess sum of weights.
- struct Protein {
...
bool ;
;
double ,
,  ;
;
string ;
;
map<Protein*,double> ;
;
double ;
;
Protein(string t) : (t)
(t)
{
 =
=  =
=  = 0;
= 0;
 = false;
}
void add_link(Protein * target, double strength)
{
 strength; //
![$w_{i,j}=w_{i}[j]$](img154.png)
}
void set_total()
{
map<Protein*,double>::iterator lit;
for(lit = interactions.begin(); lit != interactions.end() ; lit++)
 +=lit->second;
}
static double = 0;
= 0;
void update_val()
{
if ( ) return;
double = 0;
= 0;
for(map<Protein*,double>::iterator lit = interactions.begin();
lit != interactions.end() ; lit++)
 +=lit->first->
 *lit->second;
 =
= ;
;
 +=
+= -
- ;
;
}
void adopt_next_value()
{
if ( ) return;
 =
= ;
;
 =0;
=0;
}
for(int iter = 1; iter<2000; iter++)
{
fprintf(stderr,Iteration %d [residue=%g]\r,iter++, );
);
 =0;
=0;
for(protein_iterator = proteins.begin();
protein_iterator != proteins.end();
protein_iterator++)
protein_iterator->second->update_val();
for(protein_iterator = proteins.begin();
protein_iterator != proteins.end();
protein_iterator++)
protein_iterator->second->adopt_next_value();
}
int main(int argc, char* argv[])
{
Sheet interactionmap, generegulation;
map<string,Protein*> proteins;
// allocate all the proteins
for(int i = 0 ; i < interactionmap.size() ; i++)
{
Row r = *interactionmap[i];
proteins[r[im_from_gene]] = new Protein(r[im_from_gene+1]);
proteins[r[im_to_gene]] = new Protein(r[im_to_gene+1]);
}
// set the values of the initial proteins
for(int i = 0 ; i < generegulation.size(); i++)
{
Row r = *generegulation[i];
if (r.size()<2) continue;
string geneid = r[0];
string regulation = r[1];
Rows & r2 = interactionmap.lookupRows(im_from_gene,geneid);
Rows & r3 = interactionmap.lookupRows(im_to_gene,geneid);
if (r2.size() || r3.size())
{
Protein * protein = proteins[geneid];
protein->init_protein = true;
protein->current += atof(regulation.c_str());
protein->count++;
}
}
// create the protein-interaction network
map<string,Protein*>::iterator protein_iterator;
for(protein_iterator = proteins.begin() ; protein_iterator != proteins.end(); protein_iterator++)
{
string geneid = protein_iterator->first;
Protein * protein = protein_iterator->second;
Rows & out = interactionmap.lookupRows(im_from_gene,geneid);
Rows & in = interactionmap.lookupRows(im_to_gene,geneid);
for(int i = 0 ; i < out.size() ; i ++)
protein->add_link(proteins[out[i][im_to_gene]],
out[i]->get_float(im_strength));
for(int i = 0 ; i < in.size() ; i ++)
protein->add_link(proteins[in[i][im_from_gene]],
in[i]->get_float(im_strength));
}
for(protein_iterator = proteins.begin() ; protein_iterator != proteins.end(); protein_iterator++)
{
Protein * n = protein_iterator->second;
if (n->count) n->current/=n->count;
n->set_total();
}
...
// now we print out the results
for(protein_iterator = proteins.begin() ; protein_iterator != proteins.end(); protein_iterator++)
{
string n = protein_iterator->first;
Protein * r = protein_iterator->second;
if (!r->init_protein)
printf(%s\t%g\t%s\n,n,r->current, r->text);
}
Bibliography
| 1. | The Gene Ontology (GO) database and informatics resource M.A. Harris, J.Clark, A. Ireland, J. Lomax, M. Ashburner, R. Foulger, K. Eilbeck, S. Lewis, B. Marshall, C. Mungall, J. Richter, G.M. Rubin, J.A. Blake, C. Bult, M. Dolan, H. Drabkin, J.T. Eppig, D.P. Hill, L. Ni, M. Ringwald, R. Balakrishnan, J.M. Cherry, Nucleic Acids Res; pages: D258-261; Jan; 2004 |
| 2. | Modeling and Simulation of Genetic Regulatory Systems: A Literature Review Hidde De Jong Jounrla of Computational Biology; volume: 9; number: 1; pages: 67-103; 2002 |
| 3. | Algorithms for Identifying Boolean Networks and Related Biological Networks Based on Matrix Multiplication and Fingerprint Function Tatsuya Akutsu, Satoru Miyano, Satoru Kuhara. Journal of Computational Biology; volume: 7; number: 3--4; pages: 331-343; August; 2000 |
| 4. | Boolean dynamics of biological networks with multiple coupled feedback loops YK Kwon, KH Cho Biophys J; volume: 92; number: 8; pages: 2975-2981; April; 2007 |
| 5. | Estimating Coarse Gene Network Structure from Large-Scale Gene Perturbation Data Andreas Wagner Genome Research; volume: 12; pages: 309-315; 2002 |
| 6. | Petri net modelling of biological networks Claudine Chaouiya Briefings in Bioinformatics; 2007 |
| 7. | KAAS: an automatic genome annotation and pathway reconstruction server Y. Moriya, M. Itoh, S. Okuda, A. Yoshizawa, M. Kanehisa Nucleic Acids Res.; volume: 35; pages: W182-W185; 2007 |
| 8. | From genomics to chemical genomics: new developments in KEGG. M. Kanehisa, S. Goto, M. Hattori, KF Aoki-Kinoshita, M. Itoh, S. Kawashima, T. Katayama, M. Araki, M. Hirakawa Nucleic Acids Res.; volume: 34; pages: D354-D357; 2006 |
| 9. | Neural-network-based parameter estimation in S-system models of biological networks JS Almeida, EO Voit Genome Informatics; volume: 14; pages: 114-123; 2003 |
| 10. | Neural-Network-Based Parameter Estimation in S-System Models of Biological Networks Jonas S. Almeida, Eberhard O. Voit Genome Informatics; volume: 14; pages: 114-123; 2003 |
| 11. | On the analysis of the inverse problem of metabolic pathways using artificial neural networks P Mendes, D.B. Kell BioSystems; volume: 38; pages: 15-28; 1996 |
| 12. | Relations between the mitogen-activated protein kinase and the cAMP-dependent protein kinase pathways: Comradeship and hostility Nancy Gerits, Sergiy Kostenko, Alexey Shiryaev, Mona Johannessen, Ugo Moens Cellular Signaling; March; 2008 |
| 13. | Towards a proteome-scale map of the human proteinprotein interaction network Jean-Francois Rual, Kavitha Venkatesan, Tong Hao, Tomoko Hirozane-Kishikawa, Amelie Dricot, Ning Li, Gabriel F. Berriz, Francis D. Gibbons, Matija Dreze, Nono Ayivi-Guedehoussou, Niels Klitgord, Christophe Simon, Mike Boxem, Stuart Milstein, Jennifer Rosen Nature; volume: 437; pages: 1173-1178; October; 2005 |
| 14. | The C++ Programming Language Bjarne Stroustrup Addison Wesley; isbn: 0-201-12078-X; 1986 |
| 15. | A Fast Adaptive Layout Algorithm for Undirected Graphs Arne Frick, Andreas Ludwig, Heiko Mehldau Lecture Notes In Computer Science; Vol. 894, Proceedings of the DIMACS International Workshop on Graph Drawing; pages: 388 - 403; isbn: 3-540-58950-3; 1994 |
| 16. | Metabolic network visualization using constraint planar graph drawing Algorithm Romain Bourqui, David Auber, Vincent Lacroix, Fabien Jourdan IV '06: Proceedings of the 10th International Conference on Information Visualisation (IV'06); IEEE Computer Society; pages: 489-496; address: Washington, DC, USA; 2006 |
| 17. | Protein phosphatase 2A enhances the proapoptotic function of Bax through dephosphorylation Meiguo Xin, Xingming Deng The Journal of Biological Chemistry; volume: 281; number: 27; pages: 18859-18867; 2006 |
| 18. | Sustained Structural Change of GABAA Receptor-Associated Protein Underlies Long-Term Potentiation at Inhibitory Synapses on a Cerebellar Purkinje Neuron Shin-ya Kawaguchi, Tomoo Hirano The Journal of Neuroscience,; volume: 27; number: 25; pages: 6788-6799; 2007 |
| 19. | Specific distribution of gabarap, gec1/gabarap Like 1, gate16/gabarap Like 2, lc3 messenger RNAs in rat brain areas by quantitative real-time PCR Virginie Mansuy-Schlick, Fabrice Tolle, Régis Delage-Mourroux, Annick Fraichard, Pierre-Yves Risold, Michèle Jouvenot Brain Research; volume: 1073-1074; pages: 83-87; 2006 |
| 20. | Decreased GABAA-receptor clustering results in enhanced anxiety and a bias for threat cues F. Crestani, M. Lorez, K. Baer, C. Essrich, D. Benke, J.P. Laurent, C. Belzung, J.M. Fritschy JM, B. Lüscher, H. Mohler Nature Neuroscience; volume: 2; number: 9; pages: 833-839; Sep; 1999 |
| 21. | GABAA receptor ?2 subunit knockdown mice have enhanced anxiety-like behavior but unaltered hypnotic response to benzodiazepines Dev Chandra, Esa R Korpi, Celia P Miralles, Angel L De Blas, Gregg E Homanics BMC Neuroscience; volume: 6; number: 30; 2005 |
| 22. | Anxioselective Compounds Acting at the GABAA Receptor Benzodiazepine Binding Site J.R. Atack Curr Drug Target CNS Neurol Disord; volume: 2; number: 4; pages: 213-232; Aug; 2003 |
| 23. | Disruption of CREB function in brain leads to neurodegeneration Theo Mantamadiotis, Thomas Lemberger, Susanne C. Bleckmann, Heidrun Kern, Oliver Kretz, Ana Martin Villalba, Fran\c ois Tronche, Christoph Kellendonk, Daniel Gau, Josef Kapfhammer, Christiane Otto, Wolfgang Schmid, Günther Schütz Nature Genetics; volume: 31; pages: 47-54; 2002 |
| 24. | Function and Regulation of CREB Family Transcription Factors in the Nervous System Bonnie E. Lonze, David D. Ginty Neuron; volume: 35; number: 4; pages: 605-623; August; 2002 |
| 25. | Junctophilin-mediated channel crosstalk essential for cerebellar synaptic plasticity Sho Kakizawa, Yasushi Kishimoto, Kouichi Hashimoto, Taisuke Miyazaki, Kazuharu Furutani, Hidemi Shimizu, Masahiro Fukaya, Miyuki Nishi, Hiroyuki Sakagami, Atsushi Ikeda, Hisatake Kondo, Masanobu Kano, Masahiko Watanabe, Masamitsu Iino, Hiroshi Takeshima The EMBO Journal; volume: 26; pages: 1926-1933; 2007 |
| 26. | Junctophilins A Novel Family of Junctional Membrane Complex Proteins Hiroshi Takeshima, Miyuki Nishi, Masamitsu Iino, Kenji Kangawa Molecular Cell; volume: 6; number: 1; pages: 11-22; 2000 |
| 27. | Characterization of Human Junctophilin Subtype Genes Miyuki Nishi, Akiko Mizushima, Kan-ichi Nakagawara, Hiroshi Takeshima Biochemical and Biophysical Research Communications; volume: 273; number: 3; pages: 920-927; 2000 |
| 28. | Sensory defects in Necdin deficient mice result from a loss of sensory neurons correlated within an increase of developmental programmed cell death David Andrieu, Hamid Meziane, Fabienne Marly, Corinne Angelats, Pierre-Alain Fernandez, Françoise Muscatelli BMC Developmental Biology; volume: 6; pages: 56; 2006 |
| 29. | DOC2A and DOC2B are sensors for neuronal activity with unique calcium-dependent and kinetic properties Alexander J. A. Groffen, Reut Friedrich, Elisabeth C. Brian, Uri Ashery, Matthijs Verhage Journal of Neurochemistry; volume: 97; pages: 818-833; 2006 |
| 30. | The inhibitory effects of Disabled-2 (Dab2) on Wnt signaling are mediated through Axin Y. Jiang, C. Prunier, P.H. Howe Oncogene; volume: 27; pages: 1865-1875; 2008 |
| 31. | Microtubule-associated proteins as targets in cancer chemotherapy Kumar M.R. Bhat, Vijayasaradhi Setaluri Clinical Cancer Research; volume: 13; number: 10; pages: 2849-2854; 2007 |
| 32. | Notching up another pathway Keith Brennan, Philip Gardner BioEssays; volume: 24; pages: 405-410; 2002 |
| 33. | Transmission disequilibrium test provides evidence of association between promoter polymorphisms in 22q11 gene DGCR14 and schizophrenia H. Wang, S. Duan, J. Du, X. Li, Y. Xu, Z. Zhang, Y. Wang, G. Huang, G. Feng, L. He Journal of Neurotransmission; volume: 113; pages: 1551-1561; 2006 |
| 34. | beta-Arrestins: multifunctional cellular mediators Liza Barki-Harrington, Howard A. Rockman Physiology; volume: 23; pages: 17-22; 2008 |
| 35. | The voltage-gated calcium channel gamma subunits: a review of the literature. J.L. BlackIII Journal of Bioenergetics and Biomembranes; volume: 35; number: 6; pages: 649-60; 2003 |
| 36. | The N-terminal coiled-coil domain of the cytohesin/ARNO family of guanine nucleotide exchange factors interacts with G-alpha-q Geneviève Laroche, Patrick M. Giguère, Emilie Dupré, Gilles Dupuis, Jean-Luc Parent Molecular and Cellular Biochemistry; volume: 206; pages: 141-152; 2007 |
| 37. | Collectins and ficolins: sugar pattern recognition molecules of the mammalian innate immune system Jinhua Lu, Cathleen Teh, Uday Kishore, Kenneth B.M. Reid Biochimica et Biophysica Acta; volume: 1572; pages: 387-400; 2002 |
| 38. | Tropoelastin Steven G. Wise, Anthony S. Weiss The International Journal of Biochemistry and Cell Biology; 2008 |
| 39. | Myosin VI: two distinct roles in endocytosis Tama Hasson Journal of Cell Science; volume: 116; pages: 3453-3461; 2003 |
| 40. | Disabled-2 is an epithelial surface positioning gene Dong-Hua Yang, Kathy Q. Cai, Isabelle H. Roland, Elizabeth R. Smith, Xiang-Xi Xu The Journal of Biological Chemistry; volume: 282; number: 17; pages: 13114-13122; 2007 |
| 41. | Disabled-2 heterozygous mice are predisposed to endometrial and ovarian tumorigenesis and exhibit sex-biased embryonic lethality in a p53-null background Dong-Hua Yang, Zia Fazili, Elizabeth R. Smith, Kathy Qi Cai, Andres Klein-Szanto, Cynthia Cohen, Ira R. Horowitz, Xiang-Xi Xu Americal Journal of Pathology; volume: 169; number: 1; pages: 258-267; 2006 |
| 42. | Regulating cell migration: calpains make the cut. A. Wells, A. Huttenlocher, D.A. Lauffenburger J Cell Sci.; volume: 118; number: 17; pages: 3829-3838; Sep; 2005 |
| 43. | Calpain proteases in cell adhesion and motility A. Wells, A. Huttenlocher, D.A. Lauffenburger Int Rev Cytol.; volume: 245; pages: 1-16; 2005 |
| 44. | LTP consolidation: substrates, explanatory power, and functional significance. G. Lynch, C.S. Rex, C.M. Gall Neuropharmacology; volume: 52; number: 1; pages: 12-23; Jan; 2007 |
| 45. | Proteases involved in long-term potentiation Y. Tomimatsu, S. Idemoto, S. Moriguchi, S. Watanabe, H. Nakanishi Life Sci; volume: 72; number: 4--5; pages: 355-361; Dec; 2002 |
| 46. | Scaffolding by ERK3 regulates MK5 in development Stefanie Schumacher, Kathrin Laas, Shashi Kant, Yu shi, Axel Kotlyarov, Matthias Gaestel The EMBO Journal; volume: 23; number: 24; pages: 4770-9; 2004 |
| 47. | Modulation of F-actin rearrangement by the cyclic AMP/cAMP-dependent protein kinase (PKA) pathway is mediated by MAPK-activated protein kinase 5 and requires PKA-induced nuclear export of MK5. Nancy Gerits, Theresa Mikalsen, Sergiy Kostenko, Alexey Shiryaev, Mona Johannessen, Ugo Moens Journal of Biological Chemistry; volume: 282; number: 51; pages: 37232-37243; 2007 |
| 48. | Phosphorylation of the ARE-binding protein DAZAP1 by ERK2 induces its dissociation from DAZ S. Morton, H.-T. Yang, N. Moleleki, D. G. Campbell, P. Cohen, S. Rousseau Biochemical Journal; volume: 399; pages: 265-273; 2006 |
| 49. | Polymorphisms in human homeobox HLX1 and DNA repair RAD51 genes increase the risk of therapy-related acute myeloid leukemia Mays Jawad, Claire Helen Seedhouse, Nigel Russell, Mark Plumb Blood; volume: 108; number: 12; pages: 3912-3918; 2006 |
| 50. | Biological functions of melanoma-associated antigens Jiang Xiao, Hong-Song Chen World Journal of Gastroenterology; volume: 10; number: 13; pages: 1849-1853; 2004 |
| 51. | FRA-1 protein overexpression is a feature of hyperplastic and neoplastic breast disorders Gennaro Chiappetta, Angelo Ferraro, Gerardo Botti, Mario Monaco, Rosa Pasquinelli, Emilia Vuttariello, Liliane Arnaldi, Maurizio DiBonito, Giuseppe D'Aiuto, Giovanna Maria Pierantoni, Alfredo Fusco BMC Cancer; volume: 7; pages: 17; 2007 |
| 52. | FRA-1 expression level regulates proliferation and invasiveness of breast cancer cells Karine Belguise, Nathalie Kersual, Florence Galtier, Dany Chalbos Oncogene; volume: 24; pages: 1434-1444; 2005 |
| 53. | Rho GTPases of the RhoBTB subfamily and tumorigenesis Jessica Berthold, Kristina Schenkova, Francisco Rivero Acta Pharmacol. Sin.; volume: 29; number: 3; pages: 285-295; 2008 |
| 54. | RhoBTB2 (DBC) is a mitotic E2F1 target gene with a novel role in apoptosis Scott N. Freeman, Yihong Ma, W. Douglas Cress The Journal of Biological Chemistry; volume: 283; number: 4; pages: 2353-2362; 2008 |
| 55. | Constitutive turnover of cyclin E by Cul3 maintains quiescence Justina D. McEvoy, Uta Kossatz, Nisar Malek, Jeffrey D. Singer Molecular and Cellular Biology; volume: 27; number: 10; pages: 3651-3666; 2007 |
| 56. | Deleted in oral cancer-1 (doc-1), a novel oral tumor suppressor gene Randy Todd, Jim McBride, Takanori Tsuji, R. Bruce Donoff, Masazumi Nagai, Ming Yung Chou, Tao Chiang, David T. W. Wong FASEB Journal; volume: 9; pages: 1362-1370; 1995 |
| 57. | Epigenetic silencing of a Ca2+ regulated Ras GTPase-activating protein RASAL defines a new mechanism of Ras activation in human cancers Hongchuan Jin, Xian Wang, Jianming Ying, Ada H. Y. Wong, Yan Cui, Gopesh Srivastava, Zhong-Ying Shen, En-Min Li, Qian Zhang, Jie Jin, Sabine Kupzig, Anthony T. C. Chan, Peter J. Cullen, Qian Tao Proceedings of the National Academy of Sciences of the USA; volume: 104; number: 30; pages: 12353-12358; 2007 |
| 58. | PDZ-binding kinase/T-LAK cell-originated protein kinase, a putative cancer/testis antigen with an oncogenic activity in breast cancer Jae-Hyun Park, Meng-Lay Lin, Toshihiko Nishidate, Yusuke Nakamura, Toyomasa Katagiri Cancer Research; volume: 66; number: 18; pages: 9186-9195; 2006 |
| 59. | Defects in cell growth regulation by C_18:0-ceramide and longevity assurance gene 1 in human and neck Squamous cell carcinomas Serap Koybasi, Can E. Senkal, Kamala Sundararaj, Stefka Spassieva, Jacek Bielawski, Walid Osta, Terry A. Day, James C. Jiang, S. Michal Jazwinski, Yusuf A. Hannun, Lina M. Obeid, Besim Ogretmen The Journal of Biological Chemistry; volume: 279; number: 43; pages: 44311-44319; 2004 |
| 60. | FBXW7 mutation in adult T-cell and B-cell acute lymphocytic leukemias Jee Hoon Song, Nikolai Schnittke, April Zaat, Christine S. Walsh Carl W. Miller Leukemia Research; 2008 |
| 61. | Control of hematopoietic stem cell quiescence by the E3 ubiquitin ligase Fbw7 Benjamin J. Thompson, Vladimir Jankovic, Jie Gao, Silvia Buonamici, Alan Vest, Jennifer May Lee, Jiri Zavadil, Stephen D. Nimer, Iannis Aifantis Journal of Experimental Medicine; volume: 205; number: 6; pages: 1395-1408; 2008 |
| 62. | FBW7 ubiquitin ligase : a tumour suppressor at the crossroards of cell division, growth and differentiation Markus Welcker, Bruce E. Clurman Nature Reviews Cance; volume: 8; pages: 83-93; 2008 |
| 63. | Loss of disabled-2 expression is an early event in esophagal squamous tumorigenesis Kumar Anupam, Chatopadhyay Tusharkant, Siddhartha Data Gupta, Ralhan Ranju World Journal Gastroenterology; volume: 12; number: 37; pages: 6041-6045; 2006 |
| 64. | PRAK is essential for ras-induced senescence and tumor suppression Peiqing Sun, Naoto Yoshizuka, Liguo New, Bettina A. Moser, Yilei Li, Rong Liao, Changchuan Xie, Jianming Chen, Qingdong Deng, Maria Yamout, Meng-Qiu Dong, Costas G. Frangou, John R. YatesIII, Peter E. Wright, Jiahuai Han Cell; volume: 128; pages: 295-308; 2007 |
| 65. | Protein phosphatase-2A is a target of epigallocatechin-3-gallate and modulates p53-Bak apoptotic pathway Jichao Qin, Hi-Ge Chen, Qin Yan, Mi Deng, Jinping Liu, Stephan Doerge, Weiya Ma, Zigang Dong, David Wan-Cheng Li Cancer Research; volume: 68; number: 11; pages: 4150-4162; 2008 |
| 66. | MAPKAPK2 is a cell cycle checkpoint kinase that regulates the G2/M transition and S phase progression in response to UV irradiation Isaac A. Manke, Anhco Nguyen, Daniel Lim, Mary Q. Stewart, Andrew E.H. Elia, Michael B. Yaffe Molecular Cell; volume: 17; pages: 37-48; 2005 |
| 67. | Cdc25B phosphorylation by p38 and MK-2 Matthieu Lemaire, Carine Froment, Rose Boutros, Odile Mondesert, Angel R. Nebreda, Bernard Monsarrat, Bernard Ducommun Cell cycle; volume: 5; number: 15; pages: 1649-1653; 2006 |
| 68. | DNA damage-induced activation of p53 by the checkpoint kinase Chk2 Atsushi Hirao, Young-Yun Kong, Shuhei Matsuoka, Andrew Wakeham, Jürgen Ruland, Hiroki Yoshida, Dou Liu, Stephen J. Elledge, Tak W. Mak Science; volume: 287; pages: 1824-1827; 2000 |
| 69. | p53-deficient cell rely on ATM- and ATR-mediated checkpoint signaling through the p38 MAPK/MK2 pathway for survival after DNA damage H. Christian Reinhardt, Aaron S. Aslanian, Jacqueline A. Lees, Michael B. Yaffe Cancer Cell; volume: 11; pages: 175-189; 2007 |
| 70. | Ephrin-B3 ligand promotes glioma invasion through activation of Rac1. Mitsutoshi Nakada, Kelsey L. Drake, Satoko Nakada, Jared A. Niska, Michael E. Berens Cancer Research 66(17):8492-500.Click here to read; volume: 66; number: 17; pages: 8492-500; 2006 |
| 71. | title lost Dohoney et al Oncogene; volume: 23; pages: 49-57; 2001 |
| 72. | GOToolBox: functional analysis of gene datasets based on Gene Ontology David Martin, Christine Brun, Elisabeth Remy, Pierre Mouren, Denis Thieffry, Bernard Jacq Genome Biology; volume: 5; number: 12; pages: R101; 2004 |
| 73. | A Comparison of Genetic Network Models L.F.A. Wessels, E.P. Van Someren, M.J.T. Reinders Proceeding of the Pacific Symposium on Biocomputing; pages: 508-519; volume: 6; 2001 |
| 74. | Modulation of F-actin rearrangement by the cAMP/PKA pathway is mediated by MAPKAP kinase 5 and requires PKA-induced nuclear export of MK5. Nancy Gerits, Theresa Mikalsen, Sergiy Kostenko, Alexey Shiryaev, Ugo Moens Journal of Biological Chemistry; volume: 282; number: 51; pages: 37232-43; 2007 |
| 75. | Statistical methods for identifying differentially expressed genes in replicated cdna microarray experiments Sandrine Dudoit, Yee Hwa Yang, J. Matthew Callow, Terence P. Speed Department of Biochemistry, Stanford University School, Beckman Center B400, Stanford CA 94305-5307; 2000 |
| 76. | Numerical recipes in C++ William H. Press, Saul A. Teulkolsky, William T. Vetterling, Brian P. Flannery Cambridge University Press, 2nd edition; chapter: 14; 2002 |
| 77. | Contingency table involving small numbers and the chi^2 test F. Yates J R Stat Soc, (Supplement); volumne: 1; pages: 217-235; 1934 |
| 78. | An alternative to null-hypothesis significance tests P.R. Killeen Psychol Sci; volume: 16; number: 5; pages: 345-353; 2005 |
| http://werner.yellowcouch.org/ werner@yellowcouch.org |  |