
So as I am reaching the end of the year, I decided to extend the overmortality statistics from a year ago. As you might remember the overmortality was at about +13% for the entire EU. However, this year I cannot easily extend the overmortality plot because Euromomo retroactively modified their data.
On 1 January 2023 I downloaded the pooled mortality statistics. Below the some lines from there. The last column are the mortality stats
Total;2018-01;71654.22;74809.55;73226.22;76404.13;85501
Total;2018-02;71885.53;75069.23;73471.63;76678.24;83481
Total;2018-03;72034.98;75238.03;73630.7;76856.89;83207
Total;2018-04;72100.28;75312.86;73700.74;76936.58;80969
Total;2018-05;72080.58;75292.45;73680.68;76915.8;80345
Total;2018-06;71976.37;75177.37;73571.07;76795.2;81013
Total;2018-07;71789.65;74970.03;73374.1;76577.37;83458
Total;2018-08;71523.74;74674.58;73093.5;76266.9;85104
Now, let’s have a look at the data I just downloaded on 1 January 2024. Again the last column are the mortality stats
Total;2018-01;29408.44;31278.34;30338.59;32227.6;37022
Total;2018-02;29499.68;31383.58;30436.77;32340;36227
Total;2018-03;29562.04;31455.38;30503.81;32416.64;35729
Total;2018-04;29594.66;31492.49;30538.66;32456.05;34329
Total;2018-05;29597.12;31494.31;30540.8;32457.54;34123
Total;2018-06;29569.48;31460.93;30510.32;32421.21;34450
Total;2018-07;29512.3;31393.11;30447.86;32347.94;34992
Total;2018-08;29426.57;31292.27;30354.64;32239.36;35193
This is a massive modification to the data
Regression between old and new data
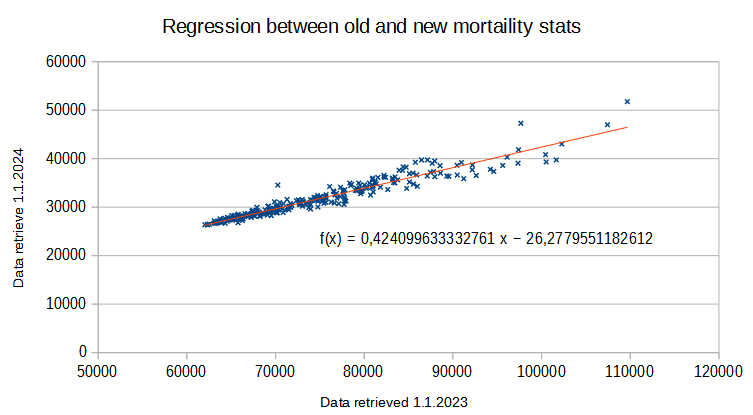
The plot above illustrates the modifications made to the data. Basically: a death now only counts for 42% of a death and each week 50 deaths were removed from the data. Or the other way around: during the pandemic every death counted twice and extra deaths were added. No idea what it is. But this type of change requires an explanation.
How does this affect the overmortality ?
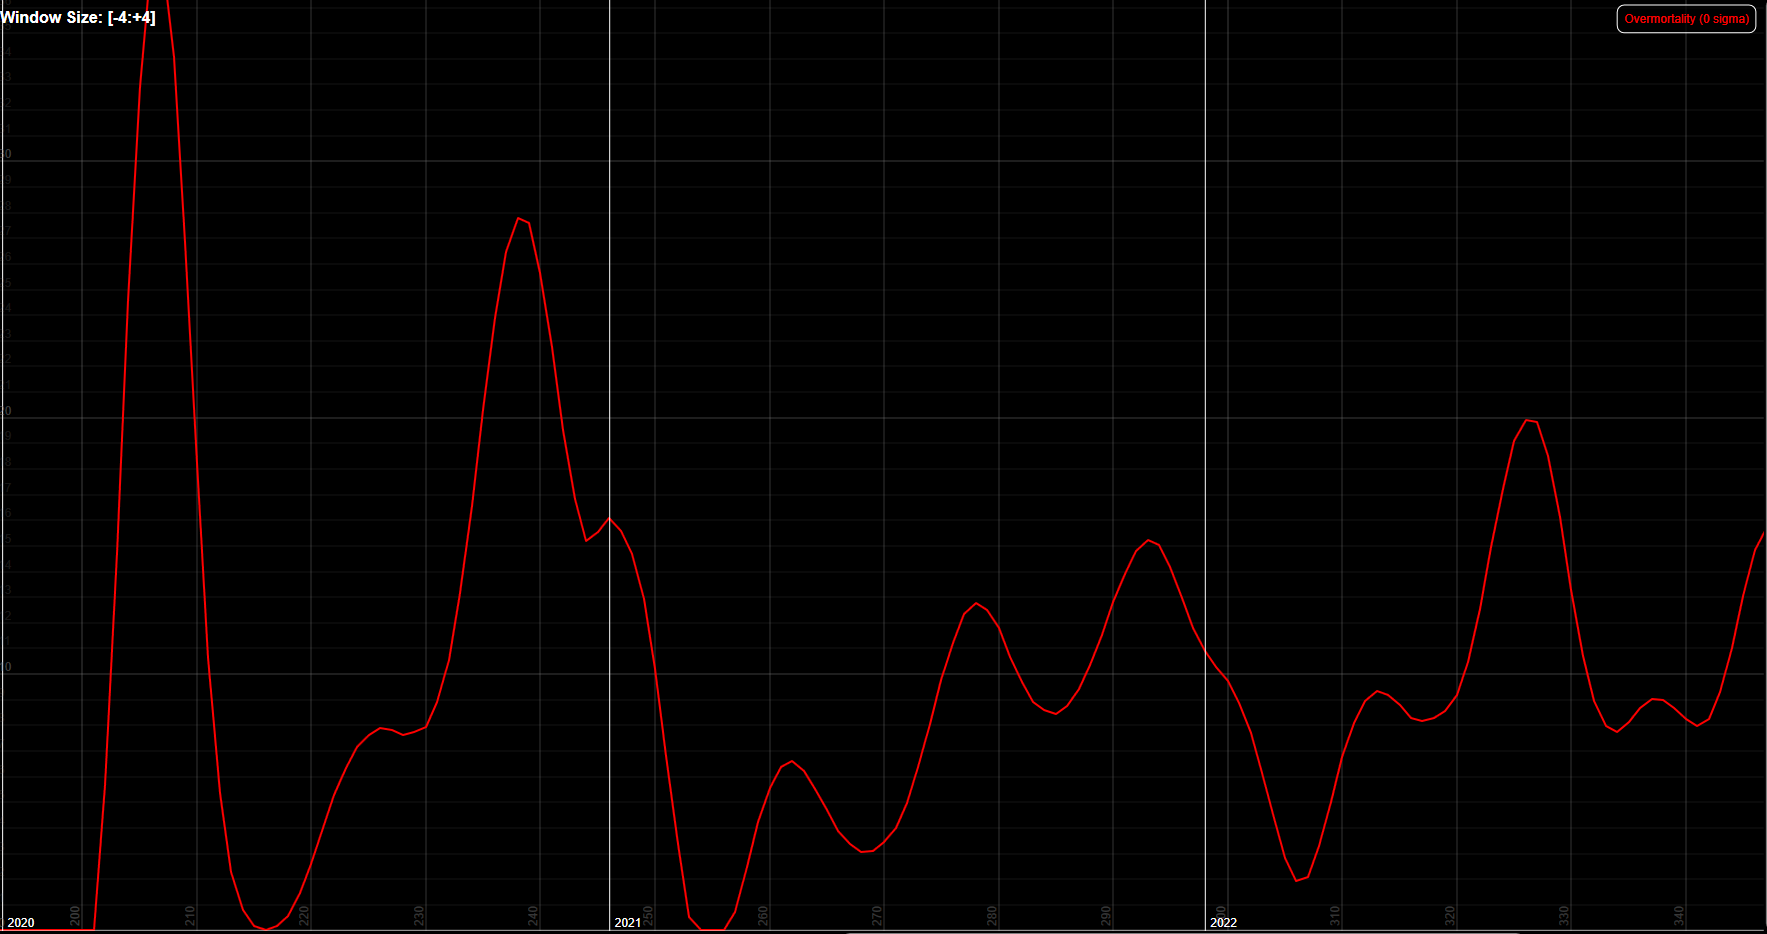
After performing a regression from the new data to the old data it is possible the extend the data we had. This lead to the following overmortality plot
Compare this to the old overmortality, which had the following plot
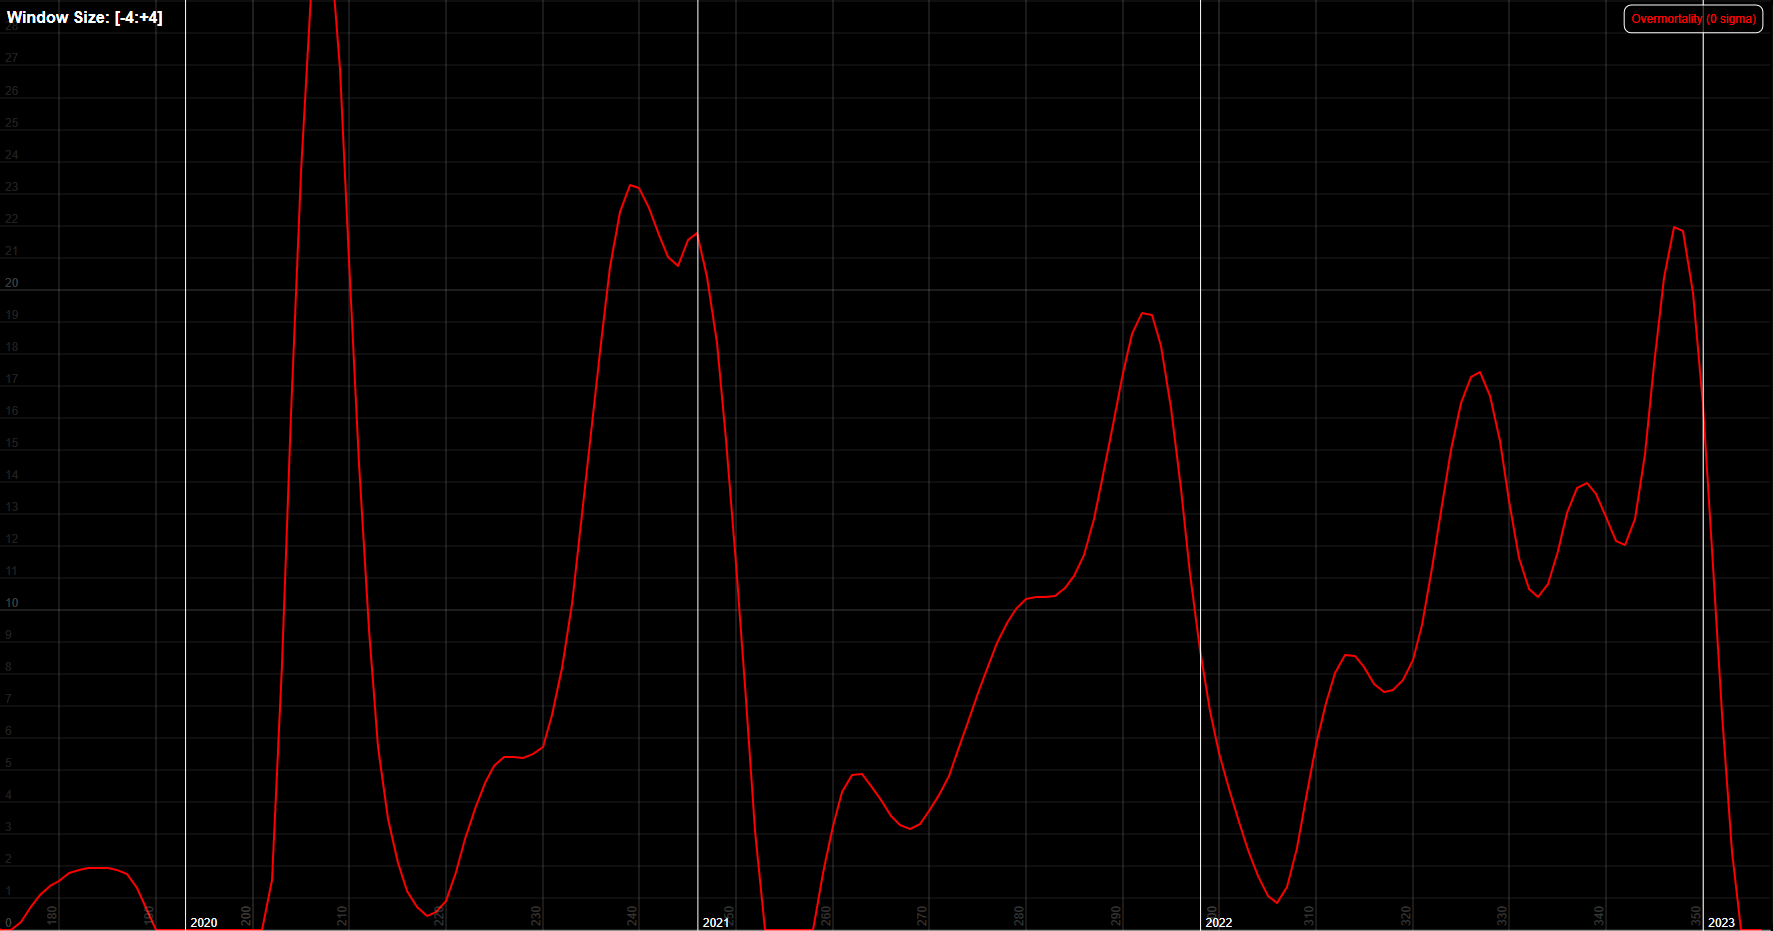
As can be seen, the over mortality in 2022 is suddenly a lower than it was a year ago. Given that nothing else but the data was changed, we must conclude that the new data from euromomo has been altered to fit their model of reality better.
New overmortality statistics
Given that we can no longer trust the data from the euromomo, it is pointless to create a new overmortality plot. Nevertheless here it is for a window of 13 weeks
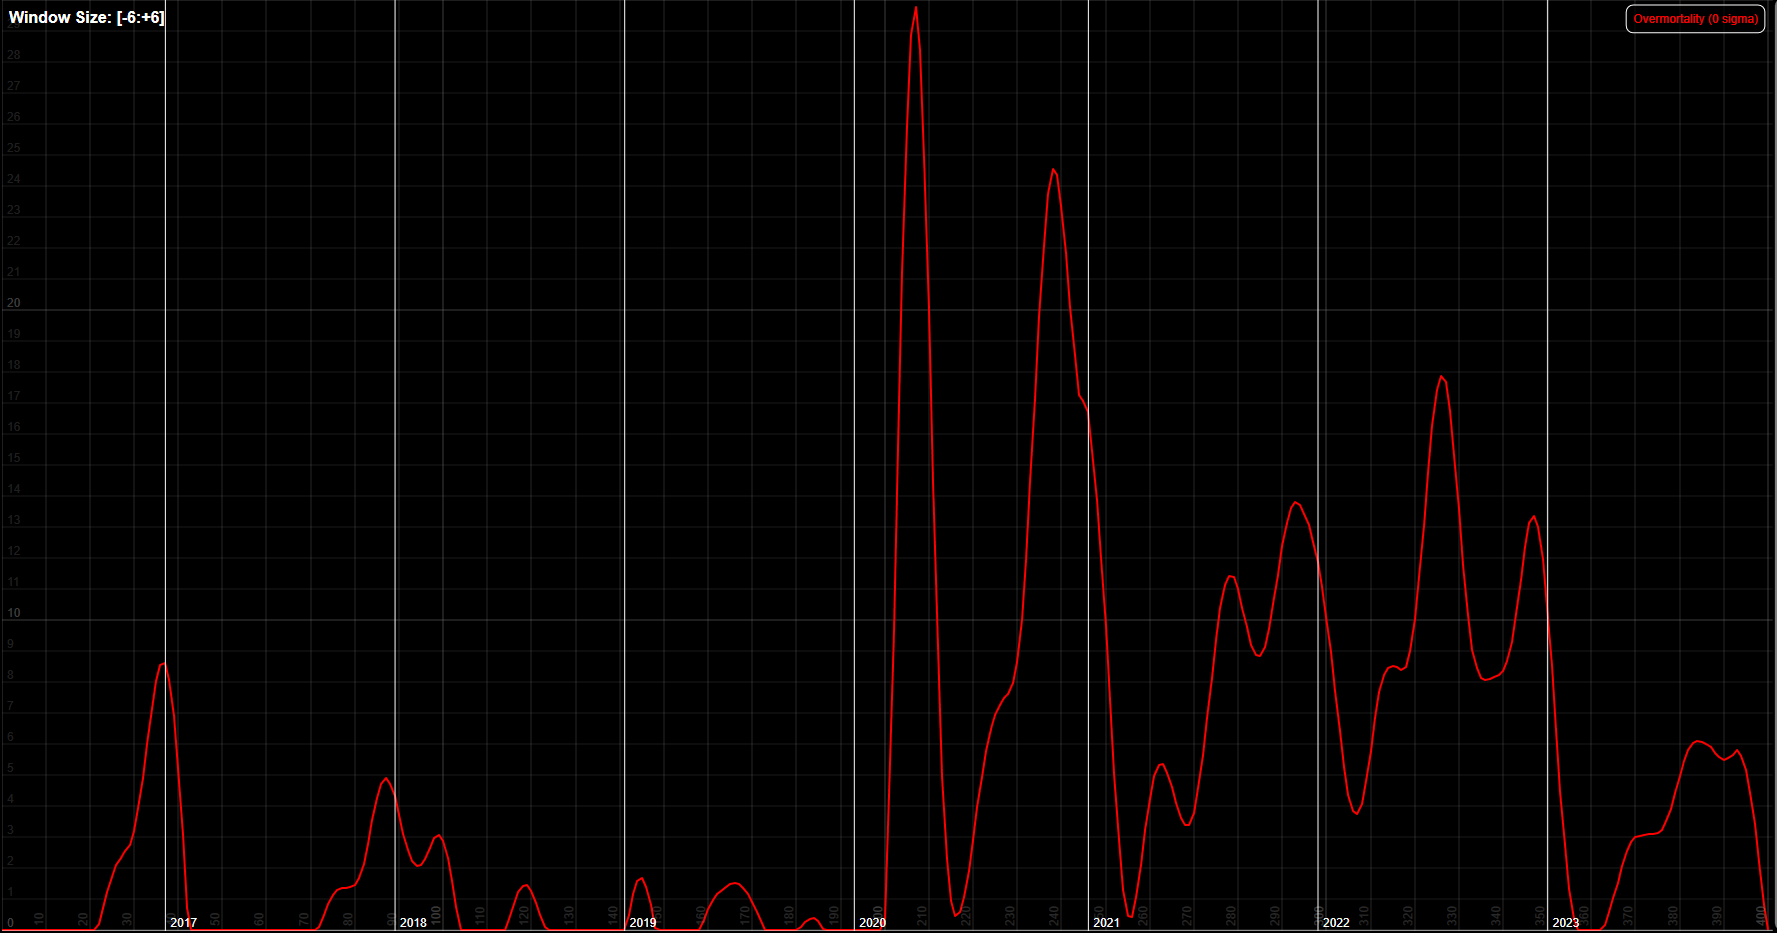
This leaves us with an overmortality of about 6%, yet as said, if we cannot rely on the veracity of the data, then this is just a ballpark figure. Not only that, we might need to assume it is a lot higher than this as there would otherwise be no reason to modify the data.